
Figures & data
Figure 1. Standard curve of Quercetin and Gallic acid for quantification of TFC and TPC, respectively.
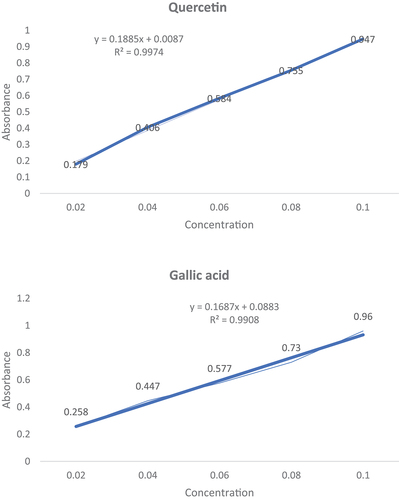
Table 1. Physicochemical Analysis of Raw Honey Adulterated with Different Sugar Syrups.
Table 2. Physicochemical Analysis of Raw Honey Adulterated with Different Sugar Syrups.
Table 3. Physicochemical Analysis of Processed Honey Adulterated with Different Sugar Syrups.
Table 4. Physicochemical Analysis of Processed Honey Adulterated with Different Sugar Syrups.
Table 5. EC 50 (mg/ml) values of reducing power of honey adulterated with different sugar syrups.
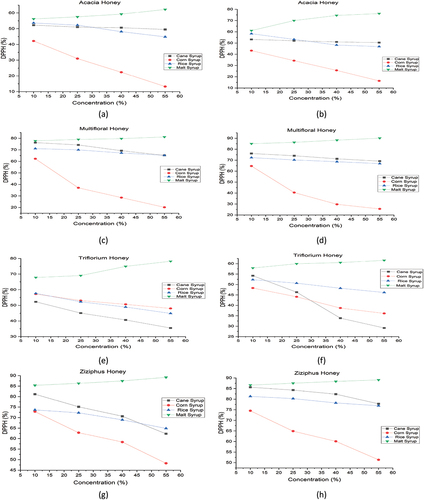
Figure 2. The effect of sugar syrups on the DPPH% of various raw and processed honey varieties; (a) Raw Acacia, (b) Processed Acacia, (c) Raw Multifloral, (d) Processed Multifloral, (e) Raw Troflorium, (f) Processed Troflorium, (g) Raw Ziziphus, and (h) Processed Ziziphus.
Data availability statement
Although adequate data has been given in the form of tables and figures, however, all authors declare that if more data are required then the data will be provided on a request basis.