
Figures & data
Table 1. Determination of phenolic contents (TPC) and total flavonoid content (TFC) of ethanolic and aqueous extract of A. roseum.
Figure 1. Cytotoxicity of (a) ethanolic and (b) aqueous extract of A. roseum measured by MTT assay. Columns with different superscript letter (a-d) are significantly different (p < .05). Negative control (DMSO 5%).
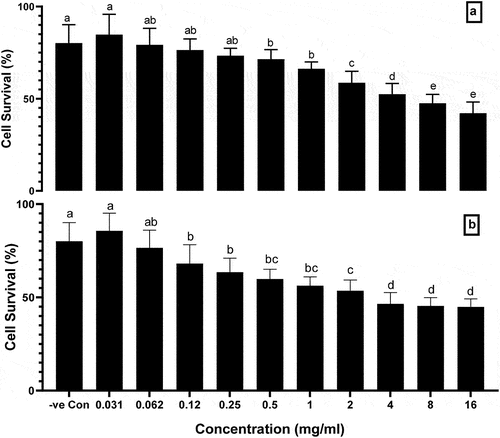
Figure 2. The effect of (a) ethanolic and (b) extract of A. roseum on tail length and head length of human lymphocytes evaluated by comet assay, Columns with different superscript letter (a-f) are significantly different (p < .05). Negative control (DMSO 5%), Positive control (H2O2 200 μM).
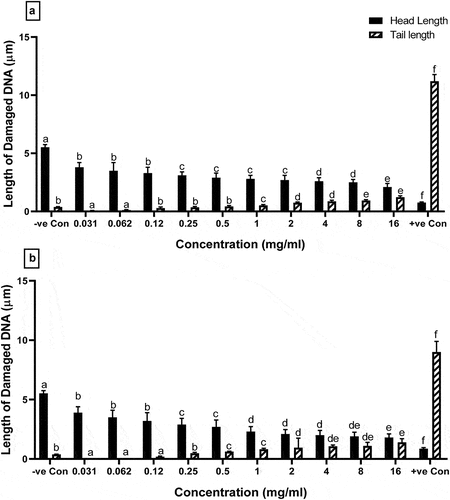
Figure 3. Visual DNA damage human lymphocytes treated with different concentrations of ethanolic extract of A. roseum. (a) 16 mg/ml: (b) 8 mg/ml: (c) 4 mg/ml: (d) 0.061 mg/ml and (e) 0.03 mg/ml.
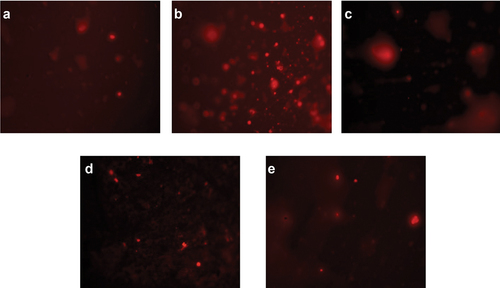
Figure 4. Visual DNA damage human lymphocytes treated with different concentrations of aqueous extract of A. roseum. (a) 16 mg/ml: (b) 8 mg/ml: (c) 4 mg/ml: (d) 0.061 mg/ml and (e) 0.03 mg/ml.
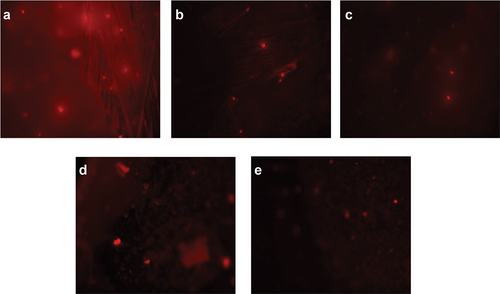
Table 2. Distribution of cell count (%) with different comet grades induced by treatment with different concentrations of ethanolic and aqueous extract of A. roseum evaluated by comet assay.
Table 3. The number (mean ± SD) of revertant colonies and mutagenicity index (MI) of S. typhimurium TA98 and TA100 exposed to ethanolic and aqueous extract of A. roseum.