Figures & data
Figure 1. The technological process of Ewe’s and Cow’s Lump cheese production..
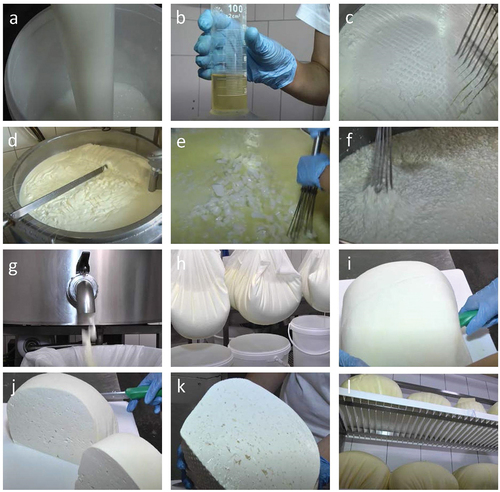
Figure 2. Fat content in Ewe’s Lump Cheese.
Figure 3. Fat content in Cow’s Lump Cheese.
Table 1. Ewe’s lump cheese fatty acid composition.
Table 2. Cow’s lump cheese fatty acid composition.
Figure 4. Ewe’s Lump cheese content of saturated, monounsaturated and polyunsaturated fatty acids.
Figure 5. Cow’s Lump cheese content of saturated, monounsaturated and polyunsaturated fatty acids.
Figure 6. Comparison of saturated fatty acids content in Ewe’s and Cow’s lump cheese.
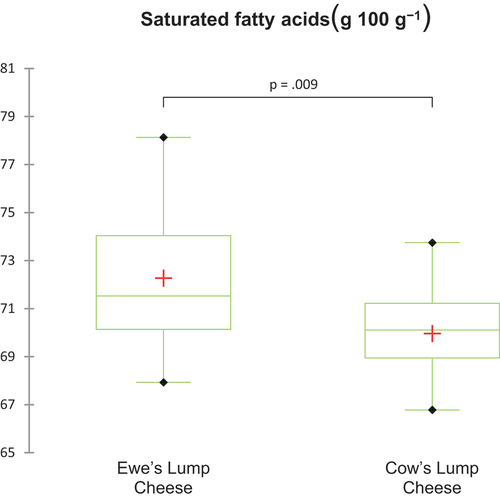
Figure 7. Comparison of monosaturated fatty acids content in Ewe’s and Cow’s lump cheese.
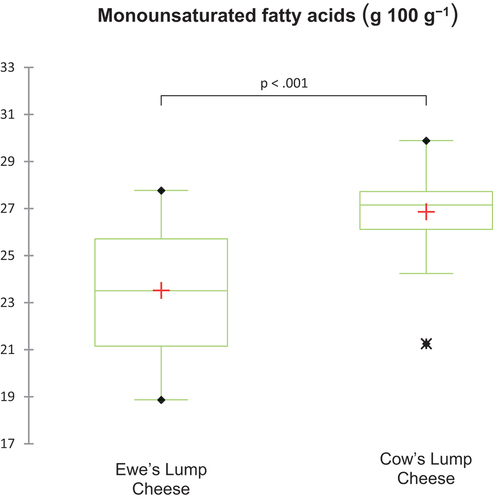
Figure 8. Comparison of polyunsaturated fatty acids content in Ewe’s and Cow’s lump cheese.
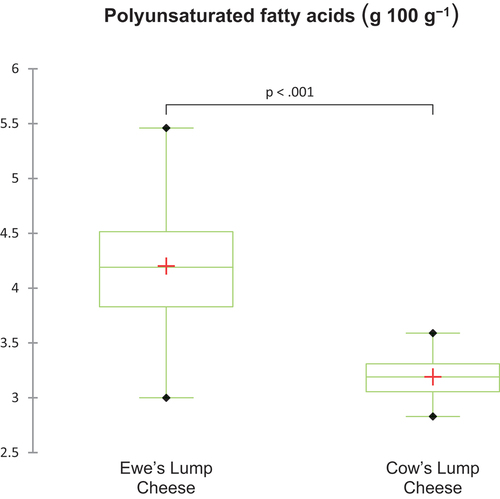
Table 3. Statistical comparison (p = .001) of fatty acid composition in Cow’s and Ewe’s lump cheese.
Figure 9. PCA analysis of Ewe’s Lump Cheese according to production batch at season.
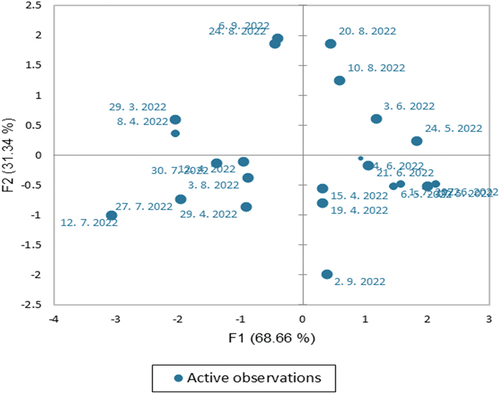
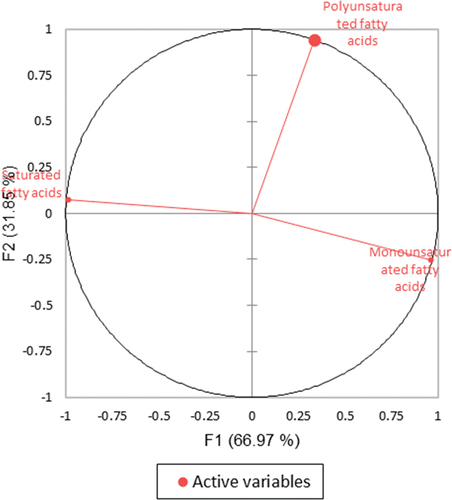
Figure 10. Representation of the main parameters of Ewe’s Lump Cheese by the PCA evaluation.
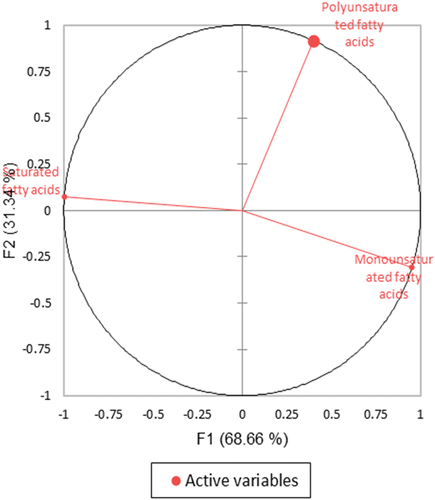
Figure 11. PCA analysis of Cow’s Lump Cheese according to production season.
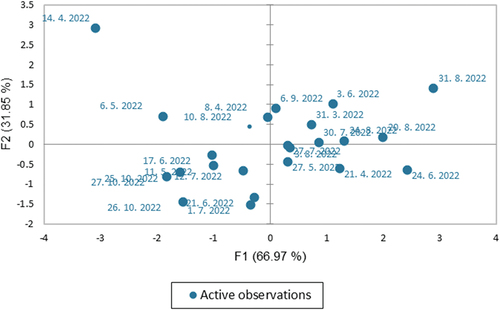
Figure 12. Representation of the main parameters of Cow’s Lump Cheese by the PCA evaluation.