
Figures & data
Figure 1. Single wavelength laser relaxation spectroscopy detection system.
Figure 2. Algorithm flow diagram: (a) BP algorithm structure diagram; (b) DELM algorithm flow chart.
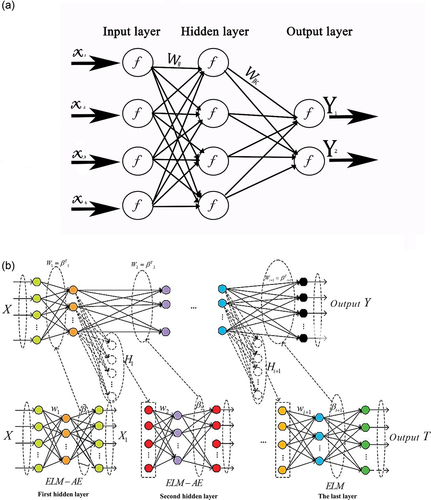
Table 1. Comparison of the advantages and disadvantages of different models.
Table 2. Parameters and results of different model runs.
Figure 3. Results of different models: (a) DELM and SSA-DELM model test set classification results; (b) SSA-DELM algorithm convergence curve; (c) BP neural network structure visualization model diagram; (d) BP neural network training set and validation set accuracy graph; (e) BP neural network training set and validation set loss value graph.
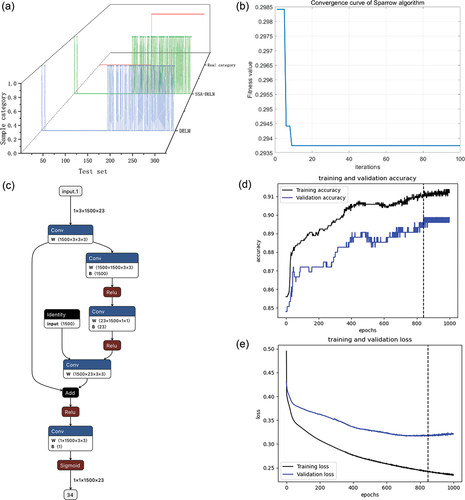
Table 3. Comparison of accuracy of different models optimized by MMCR.
Data availability statement
Data sharing does not apply to this article as no datasets were generated or analyzed during the current study.