
Figures & data
Figure 1. Typical flow sheet for Ross experimental milling batch-type system.
BK= break, T = tailings, LG = low-grade, SIZ = sizings, M = middlings, LW = light wire, GG = grit gauze, XX = flour silk.
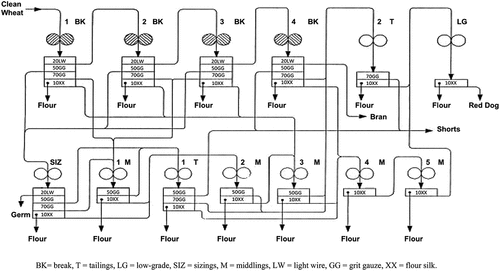
Table 1. NIR protein and moisture content of mill streams.
Table 2. NIR gluten and ash content of mill streams.
Table 3. NIR Zeleny value and fat content of mill streams.
Figure 2. (a). Presence of 15 kDa band in mill streams B1, B2, B3, B4, M1, M2, M3 (b). M4, M5, T1, T2, sizing and LG of AS-2002 (c). 15 kDa band in millstreams B1, B2, B3, B4, M1, M2, M3, M4. (d). M5, T1, T2, sizing and LG of Inqulab-91.
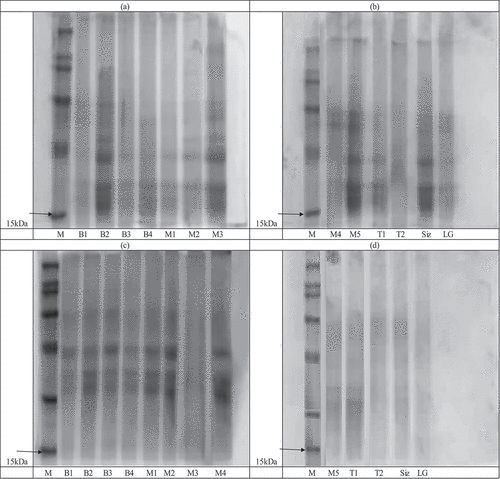
Table 4. Correlation of friabilin with different chemical constituents of flour streams.
Table 5. Friabilin protein by SDS-PAGE in different mill streams of wheat varieties.