
Figures & data
Table 1. Independent variables and levels used in Box-Behnken design for TP preparation.
Table 2. Independent variables and levels used in Box-Behnken design for TP-SeNPs preparation.
Table 3. Response Surface Design and Results of the Tea Polypeptides Preparation.
Table 4. Response Surface Design and Results of the Tea peptide selenium nanoparticles Process.
Figure 1. The characterization of TP, SeNPs, and TP-SeNPs. (a) UV spectrum, (b) EDS, (c) SEM image of TP, (d) SEM images of SeNPs, (e) TEM image of TP-SeNPs ,(f) SEM image of TP-SeNPs, (g) FT-IR spectra, (h) XRD spectra.
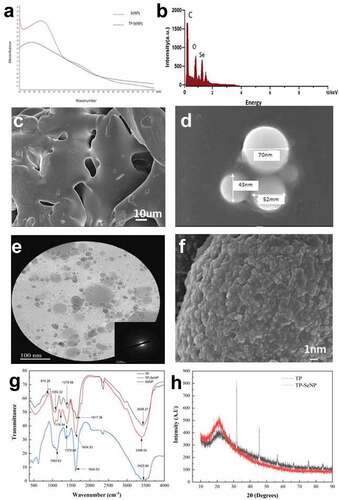
Figure 2. The antioxidant activity of TP, SeNPs and TP-SeNPs. (a) DPPH radical scavenging activity (b) ABTS radical scavenging activity (c) Hydroxyl radical scavenging activity (d) Ferric reducing antioxidant power.
Figure 3. The cell viability of TP-SeNPs.
Table 5. Inhibitory effects of TP, SeNPs and TP-SeNPs against Escherichia coli and Bacillus subtilis.