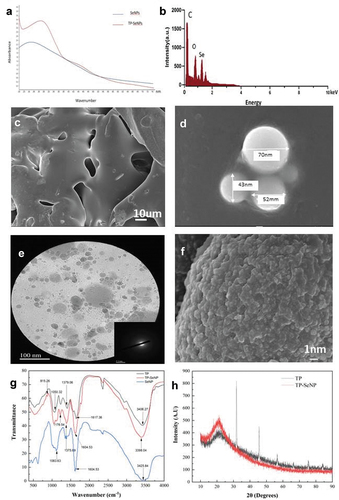
267
Views
0
CrossRef citations to date
0
Altmetric
Correction

Correction

Figures & data

Fig.1 The characterization of TP, SeNPs, and TP-SeNPs. (A) UV spectrum, (B) EDS, (C) SEM image of TP, (D) SEM images of SeNPs, (E) TEM image of TP-SeNPs,(F) SEM image of TP-SeNPs, (G) FT-IR spectra, (H) XRD spectra.

Fig.1 The characterization of TP, SeNPs, and TP-SeNPs. (A) UV spectrum, (B) EDS, (C) SEM image of TP, (D) SEM images of SeNPs, (E) TEM image of TP-SeNPs,(F) SEM image of TP-SeNPs, (G) FT-IR spectra, (H) XRD spectra.