
Figures & data
Table 1. Yield (%) of the extraction of O. stamineus leaves.
Table 2. TPC and TFC of O. stamineus Leaf Extracts.
Table 3. Inhibition Activity of DPPH and ABTS Radicals and α-glucosidase from several ethanolic extracts of O. stamineus leaves.
Figure 1. Vibration of functional group types of several extracts of O. stamineus Leaves.
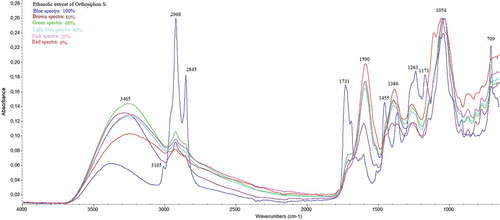
Table 4. The vibrational of functional group types from active compounds in the several ethanolic extracts of O. stamineus.
Figure 2. The validated Partial least square model used for the prediction of functional groups of O. stamineus leaf extracts is responsible for its biological activities. (A) Validated models for α-glucosidase inhibitors; (B) Validated model for DPPH radicals scavenging; (C) Validated model for ABTS radicals scavenging.
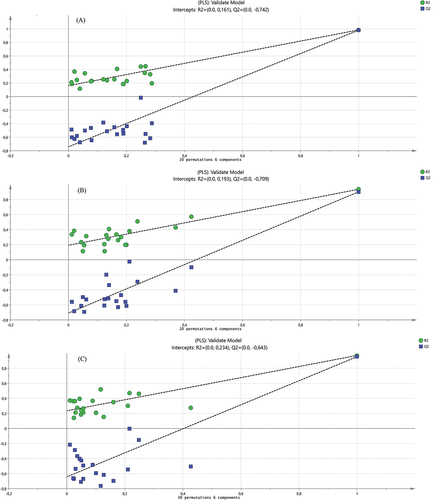
Figure 3. Principal Component Analysis of Ethanolic Extract of O. stamineus Leaves: (0) water, (20) 20% ethanol, (40) 40% ethanol, (60) 60% ethanol; (80) 80% ethanol, and (100) 100% ethanol. (a) Score plot; (b) loading plot. Inhibition activity of α-glucosidase (a); DPPH radicals (b); and ABTS radicals (c).
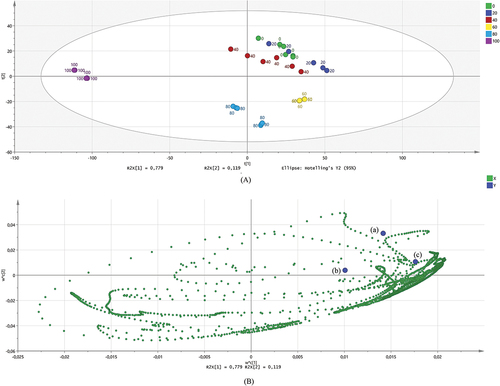
Figure 4. Loading of functional groups from O. stamineus extracts is responsible for the Inhibition of ABTS radicals, DPPH radicals, and α-glucosidase.
Figure 5. Quantitative analysis of O. stamineus extracts based on predicted value and actual value: (a) α-glucosidase inhibitors; (b) DPPH radicals scavenging; (c) ABTS radicals scavenging.
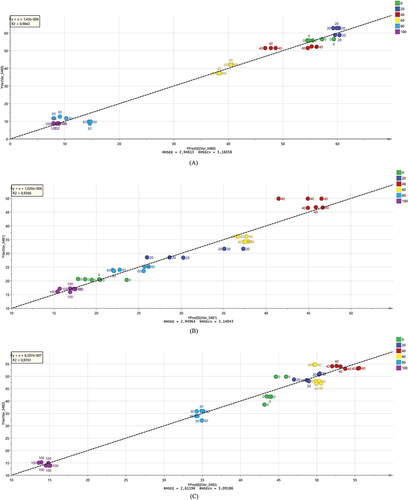
Table 5. Comparison of the inhibition activity of O. stamineus leaf extract against ABTS radicals, DPPH radicals, and α–glucosidase.