
Figures & data
Table 1. Serum concentration of Vitamin D and Calcium among cases and control groups.
Table 2. Characteristics of study participants.
Table 3. Nutritional parameters among different treatments groups at 0 days and 90 days of interventional period.
Figure 1. (a, b and c) Effect of treatments on mean values of Anthropometrics (BMI, Waist Circumference and Hand grip strength).
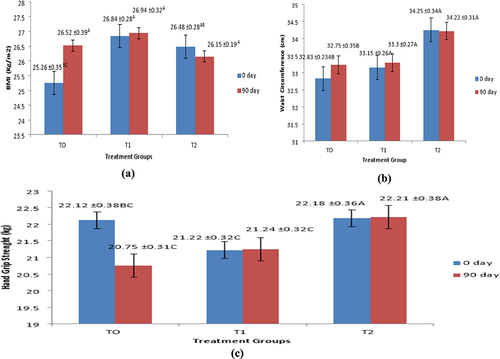
Figure 2. Effect of treatments on mean values of serum albumin.
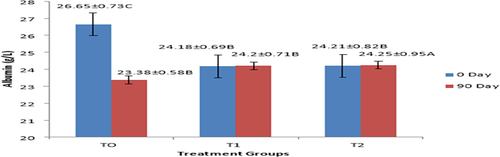
Figure 3. (a and b) Effect of treatments on mean values of serum calcium and Serum vitamin D concentrations..
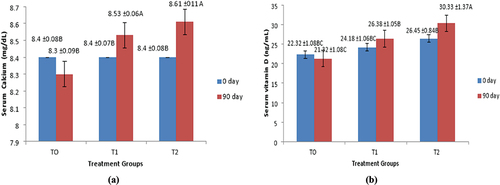
Table 4. Pearson’s correlation among anthropometrics with indicative biomarkers 90th day.
Table 5. Pearson’s correlation among indicative biomarkers with tumor markers 90th day.