Figures & data
Table 1. Farinographic and mixographic profile of dough treatments Do (Control treatment) and DOPP (bread prepared with onion peel powder). The results are presented as mean ± standard deviation. The results differ from each other by least significant difference in lowercase letters.
Figure 1. Scanning electron microscopy (SEM) images of bread samples. (a) control bread treatment, (b) bread enriched with OPP.
Figure 2. FTIR spectra of analysis of bread samples. (a) FTIR spectra for control bread treatment, (b) FTIR spectra for bread treatment enriched with OPP.
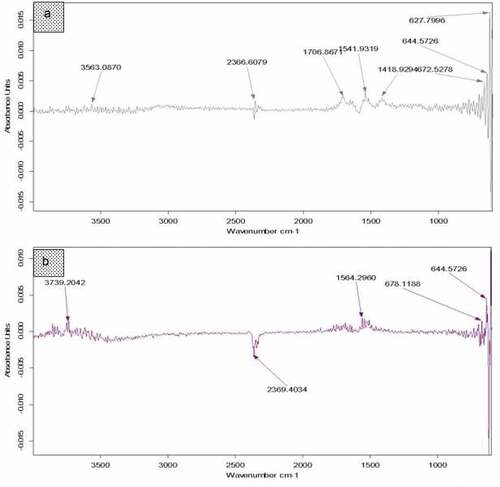
Figure 3. Total phenolic content, flavonoid content and DPPH activity of bread treatments. Bc (control bread), BOPP (bread enriched with onion peel powder).