Figures & data
Figure 1. Identification of total genes, and intersection genes in bladder cancer and COVID-19.
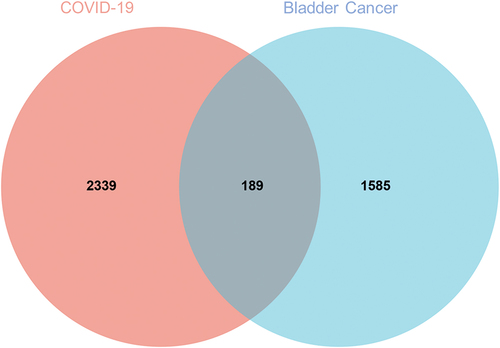
Figure 2. (a) Characteristics of 21 alternative genes with different hazard ratios in bladder cancer patients. (b) Different characteristics of changes in five-year and three-year survival ratios of bladder cancer patients.
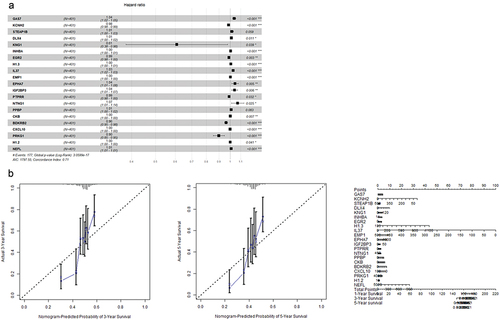
Figure 3. Characteristics of risk scores (a), survival conditions (b), and prognostic gene signatures (c).
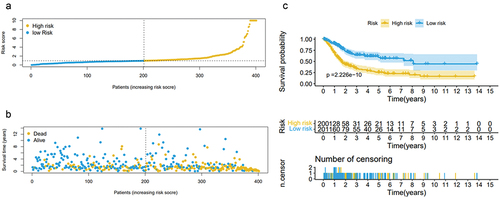
Figure 4. Risk score and staging condition as independent prognostic indicators using monofactor analysis (a). Risk score as an independent prognostic indicator using multivariate analysis (b).
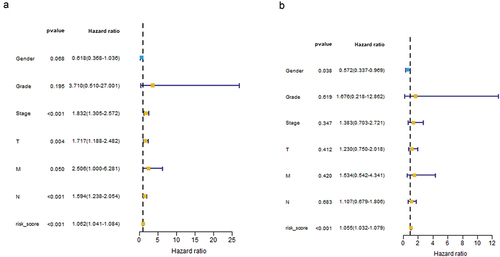
Figure 5. Characteristics of risk score, tumor node metastasis stage contributing to three- and five-year survival rate (a) and sensitivity (b) in bladder cancer patients.
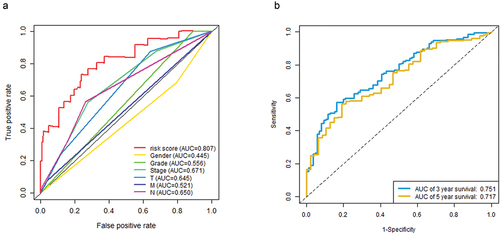
Figure 6. Distribution of risk signature genes across gene expression profiles in high- and low-risk groups, as showed in different spatial distributions (a, b, c, d).
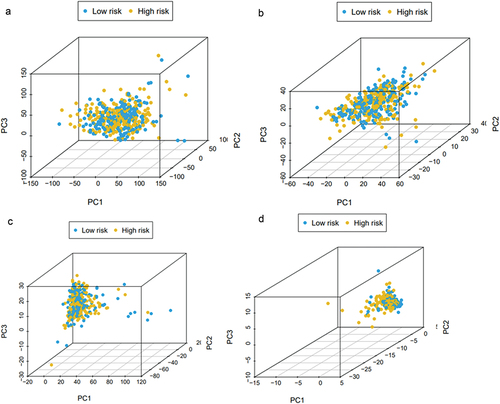
Figure 7. All 10 intersection targets of pachymic acid and bladder cancer/COVID-19 were identified. A PPI network of F2, IDO1, KCNH2, NTRK3, CCL2, PTGS2, ACTA2, MMP1, CCNE1, and THBS1 was presented.
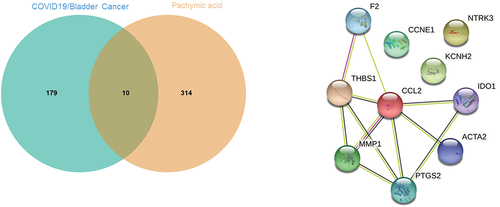
Figure 8. Enrichment analysis reported the biological processes (a), molecular functions (b), and signaling pathways (c) in intersecting genes, as showed in the bubble diagrams.
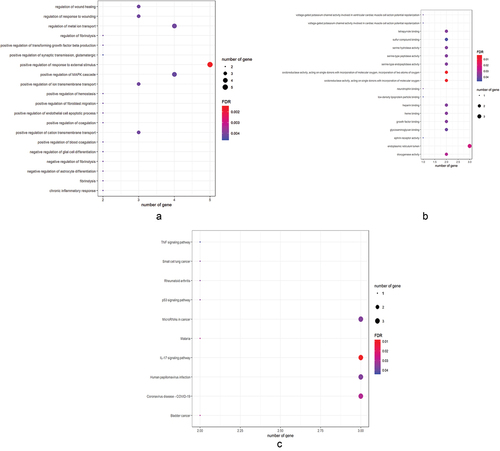
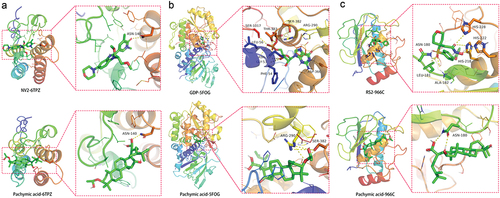
Figure 9. Molecular docking characteristics of pachymic acid with bladder cancer/COVID-19 in CCL2 (a), THBS1 (b), and MMP1 (c).