Figures & data
Table 1. Main socioeconomic results of the respondents.
Table 2. Summary of pairwise comparisons for factor (Tukey, HSD) about relevant attributes for purchase intention of all respondents.
Figure 1. Results of comparisons between beverages when asked about nutritional superiority, the healthiest, and the most sustainable.
Subtitle: SB: soy beverage, NB: nut beverage, CM: cow’s milk. a: Results expressed as mean ± standard deviation on a 5-point scale where 1-much worse; 3-neither better nor worse; 5-much better. Letters differ significantly (p < .05) among drinks from the same group of respondents. b: Results expressed as mean ± standard deviation on a 5-point scale where 1-not healthy; 3-neither healthy nor harmful to health; 5-very healthy. Letters differ significantly (p < .05) among drinks from the same group of respondents. c: Results expressed as mean ± standard deviation on a 5-point scale where 1-not sustainable; 3-indifferent; 5-very sustainable. Letters differ significantly (p < .05) among drinks from the same group of respondents.
Table 3. Percentage of respondents for each of the dimensions and categories identified in the word association test.
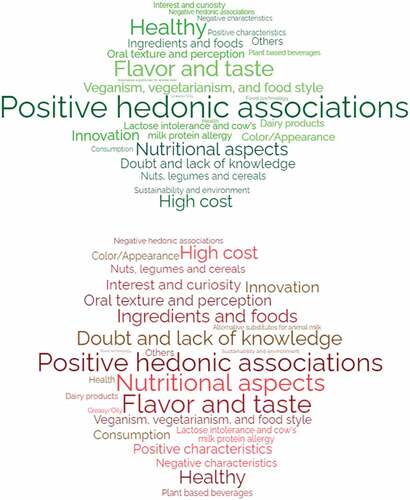
Figure 2. Word clouds from the most cited categories in the word association task of each consumer group.
Subtitle: G1= people who had tasted or were drinkers of nut beverages. G2= people who had never tasted a nut beverage.