
Figures & data
Table 1. Parameters for screening lactic acid bacteria (LAB) and yeast isolates.
Figure 1. Phylogenetic tree analysis of yeast and lactic acid bacteria (LAB) isolates. a) Phylogenetic tree of yeasts isolates b) Phylogenetic tree of LAB isolates.
Table 2. Similarity percentage of yeast and LAB isolates with NCBI GenBank database sequence.
Table 3. Effect of temperature on yeast and lactic acid bacteria growth.
Table 4. Percentage survival (%) of isolates in different pH and bile salt values for 3 h.
Figure 2. Cell surface adhesion and aggregation: a) Percentage of cell surface hydrophobicity of yeast and LAB isolates b) Percentage auto-aggregation of yeast and LAB isolates.
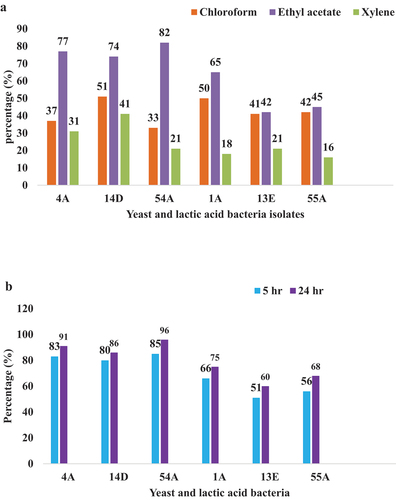
Figure 3. Co-aggregation a) Co-aggregation of isolates with Salmonella typhimurium b) Co-aggregation of isolates with Shigella dysenteriae, c) Co-aggregation of isolates with E. coli, and d) Co-aggregation of isolates with S. aureus.
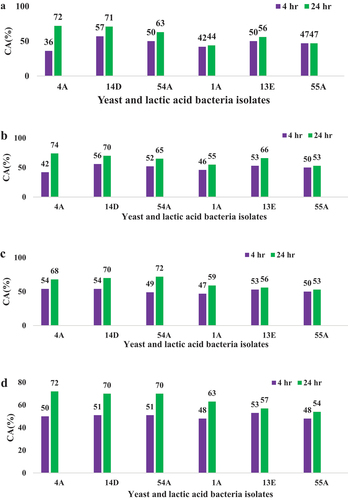
Table 5. Safety and beneficial role of LAB and yeast isolates.
Table 6. Antibiotic susceptibility of yeast and lactic acid bacteria isolates (mm on average).
Table 7. Inhibition zones of isolates against food-borne pathogens (in cm).