
Figures & data
Table 1. Grain storage biomolecules and starch chemical compositions of 19 Thai indigenous rice varieties.
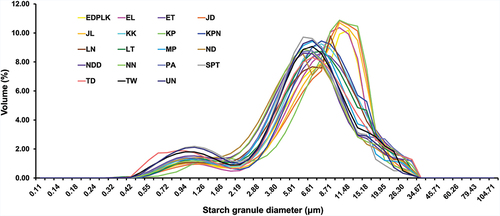
Figure 1. Granule size distribution of starches from 19 Thai indigenous rice varieties.
undefined 2. Size distribution (volume %), median particle size [d(0.5)], relative crystallinity, swelling power, and solubility of grain starch granules of 19 Thai indigenous rice varieties.
Figure 2. X-ray diffraction patterns of starch granules from 19 Thai indigenous rice varieties. The X-ray diffractogram of all rice starches revealed the typical A-type diffraction pattern, which consists of the strong and weak reflections at these corresponding diffraction angles (2θ): two strong X-ray resolved peaks at 15° and 23°, a strong X-ray unresolved peak at 17° and 18°, and a weak X-ray reflection peak of amylose-lipid complexes at 20°.5, 28
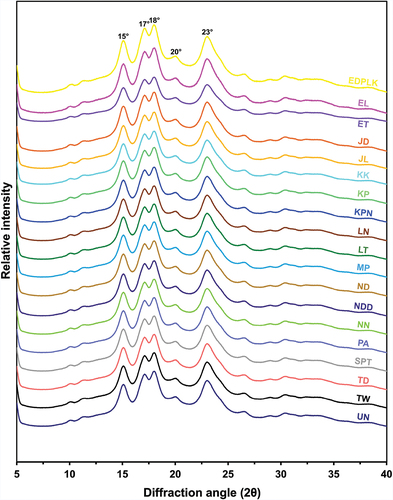
Table 3. Starch gelatinization properties of 19 Thai indigenous rice varieties.
Table 4. Starch retrogradation properties of 19 Thai indigenous rice varieties.
Figure 3. The starch pasting profiles of 19 Thai indigenous rice varieties.
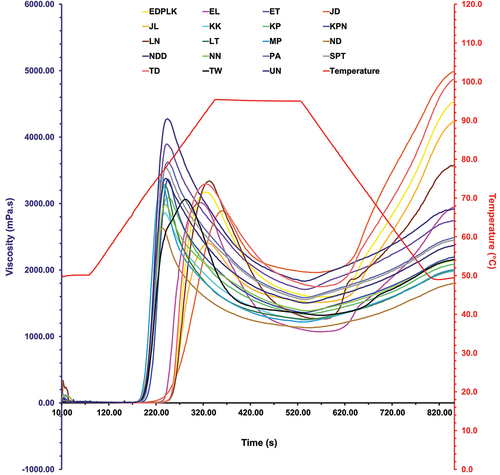
Table 5. Starch pasting properties of 19 Thai indigenous rice varieties.
Figure 4. Partial-Least Squares Discriminant Analysis (PLS-DA) of measured variables. PLS-DA (a) score plot (b) loading plot and (c) VIP plot of all variables measured in this study were shown. Each of the biological replicates was individually projected onto the plane of principal components (PC) 1 and 2. The first two highest variances were observed in the PC2 and PC1, with 85.4% and 10.8% of total variance, respectively. The confidence ellipses occupy the 95% confidence intervals of the data. The colored boxes shown on Figure 4C indicate the relative values of the corresponding parameters in each rice variety.
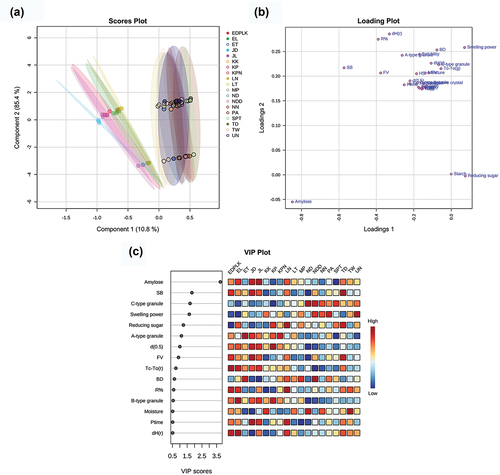
Table 6. Pearson correlation coefficients between starch chemical composition and molecular structure and starch physicochemical properties of 19 Thai indigenous rice varieties.
Supplemental Material
Download MS Word (3.4 MB)Data availability statement
The data that support the findings of this study are available from the corresponding author, MT, upon reasonable request.