Figures & data
Figure 1. Appearance of gelatinized ground rice in porridge (a – b) and light micrographs (c – f) for difference particle sizes and concentrations of ground rice in porridge (20X magnification). (a) 10% w/v concentration of small-sized particles, (b) 10% w/v concentration of large-sized particles, (c) 5% w/v concentration of small-sized particles, (d) 5% w/v concentration of large-sized particles, (e) 10% w/v concentration of small-sized particles, and (f) 10% w/v concentration of large-sized particles.
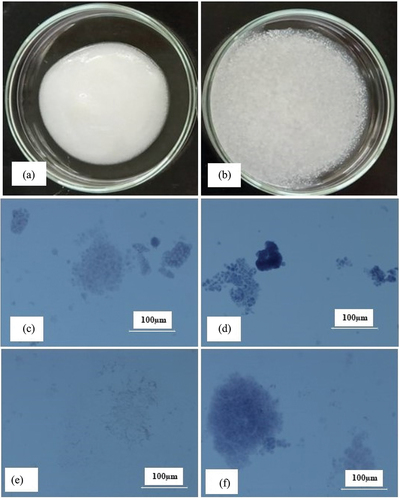
Figure 2. Particle size distribution of (a) ground rice (before cooking) and (b – d) gelatinized ground rice (after cooking) with different concentrations; (b) small-sized, (c) mixed-sized, and (d) large-sized particles in ground rice in porridge.
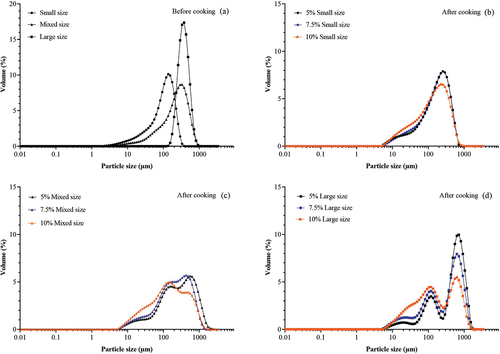
Table 1. Averaged particle size (D [4,3]), yield stress, and viscosity at shear rate of 50 s−1.
Figure 3. Viscosity (a – c) and shear stress (d – f) versus shear rate of the porridge with different particle sizes and concentrations of ground rice over a shear rate range of 0.1–1,000 s−1 at 37°C.
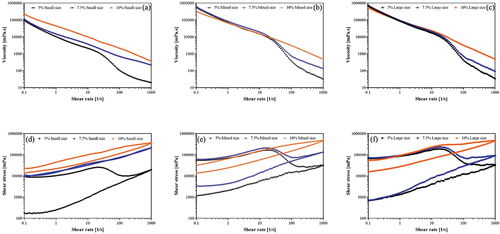
Figure 4. Stribeck curves of porridge with different particle sizes and concentrations of ground rice; (a) small-sized, (b) mixed-sized, and (c) large-sized particles.
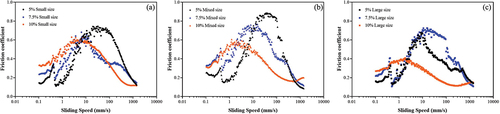
Figure 5. In vitro starch digestion of porridge with different particle sizes and concentrations, measured as area under curve (AUC) of cumulative released glucose.