Figures & data
Figure 1. Visual images of (a) control, (b) WPC, (c) SPI, (d) BSA and (e) hemoglobin-treated egg white gels and (A) control, (B) WPC, (C) SPI, (D) BSA and (E) hemoglobin-treated egg yolk gels. WPC, whey protein concentrate. SPI, soy protein isolate. BSA, bovine serum albumin.
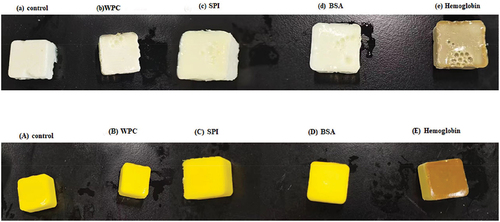
Table 1. Changes in color attributes of egg white and egg yolk gels treated byWPC, SPI, BSA and hemoglobin.
Table 2. Changes in texture attributes of egg white and egg yolk gels treated by WPC, SPI, BSA and hemoglobin.
Figure 2. Changes in the WHC of (a) liquid egg white gels and (b) liquid egg yolk gels treated by WPC, SPI, BSA and hemoglobin. Values are means ± SE of three replicates measurements. Error bars represent positive standard errors of the mean. Different lowercase letters (a-e) donate significant difference in these treatment group gels (p < .05). Means having no letter do not significantly differ at p < .05. WPC, whey protein concentrate. SPI, soy protein isolate. BSA, bovine serum albumin.
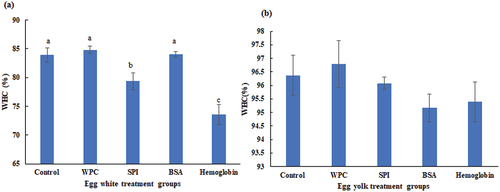
Figure 3. Changes in the free sulfhydryl group of (a) liquid egg white and (b) liquid egg yolk, surface hydrophobicity of (c) liquid egg white and (d) liquid egg yolk, protein solubility of (e) liquid egg white and (f) liquid egg yolk samples treated by WPC, SPI, BSA and hemoglobin. Values are means ± SE of three replicates measurements. Error bars represent positive standard errors of the mean. Different lowercase letters (a-e) donate significant difference in these treatment group samples (p < .05). Means having no letter do not significantly differ at p < .05. WPC, whey protein concentrate. SPI, soy protein isolate. BSA, bovine serum albumin.
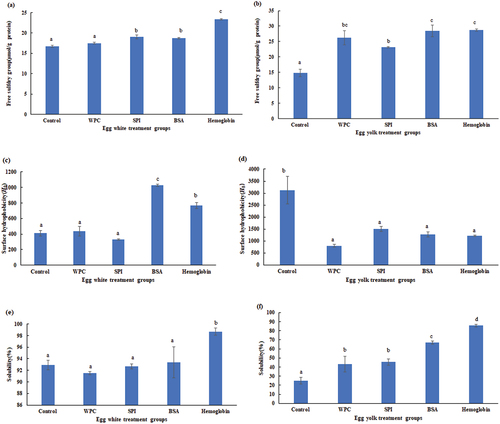
Figure 4. SDS-PAGE profiles of (a) liquid egg white and (b) liquid egg yolk samples treated by WPC, SPI, BSA and hemoglobin. 1, control; 2, WPC; 3. SPI; 4. BSA; 5. hemoglobin; HDL, high density lipoprotein, LDL, low density lipoprotein. WPC, whey protein concentrate. SPI, soy protein isolate. BSA, bovine serum albumin.
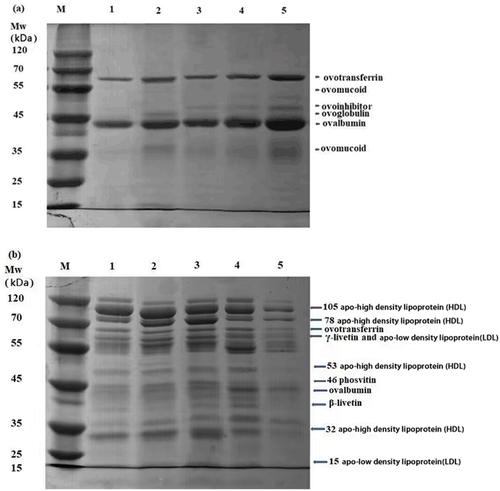
Table 3. Changes in secondary structure percentage of egg white and egg yolk gels treated by WPC, SPI, BSA and hemoglobin.
Figure 5. SEM micrographs of (a) control, (b) WPC, (c) SPI, (d) BSA and (e) hemoglobin-treated liquid egg white gels, and (A) control, (B) WPC, (C) SPI, (D) BSA and (E) hemoglobin-treated liquid egg yolk gels. 500× (scale bars, 200 μm) and 2000× (scale bars, 50 μm). WPC, whey protein concentrate. SPI, soy protein isolate. BSA, bovine serum albumin.