
Figures & data
Figure 1. Schematic diagram the self-assembly of amphiphilic compounds in Xiaoqu Baijiu at the distillation and condensation stage.
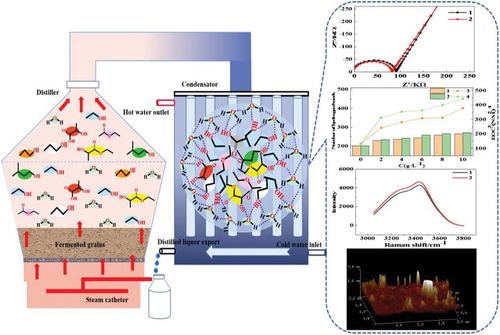
Figure 2. A shows the representative electrochemical impedance spectra of acetic acid addition to 50% ethanol with corresponding concentration gradient before and after condensation reflux. b, c and d are corresponding curve of virtual impedance with each aroma substance concentration variation. AA, LA, EA, LA, NP and IP represent acetic acid, lactic acid, ethyl acetate, ethyl lactate, n-propanol and isopentanol, respectively.
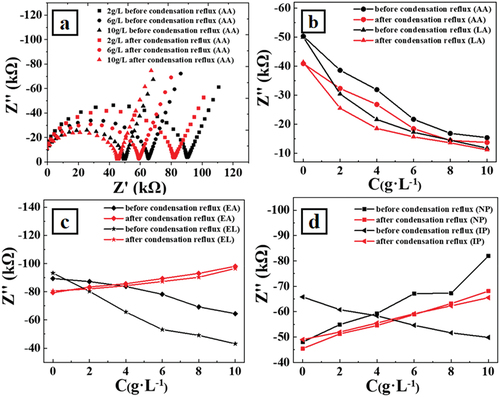
Figure 3. A shows a representative Raman spectra of ethyl lactate addition sample, dashed curves show the Gaussian peak splitting on the original Raman data. b shows the red shifts of the peaks located at 3250 cm−1 before and after condensation reflux for each of the six aroma substances addition. AA, LA, EA, EL, NP and IP represent acetic acid, lactic acid, ethyl acetate, ethyl lactate, n-propanol and isopentanol, respectively.
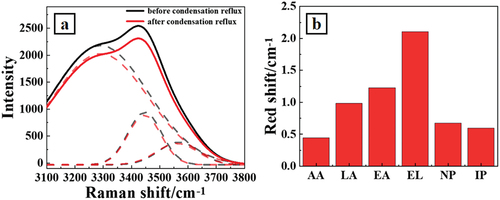
Figure 4. Shows the representative atomic force micro graph of assembled clusters which were electrochemically deposited on polished silica wafer electrodes before(4a) and after(4b) the condensation reflux operation by adding isoamyl alcohol; presents the variation of obtained clusters in diameter and height based on atomic force micro graph. AA, LA, EA, EL, NP and IP stand for acetic acid, lactic acid, ethyl acetate, ethyl lactate, n-propanol and isopentanol, respectively.
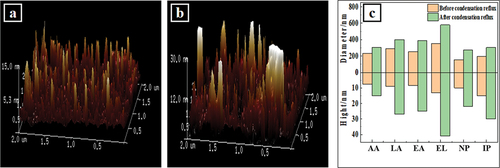
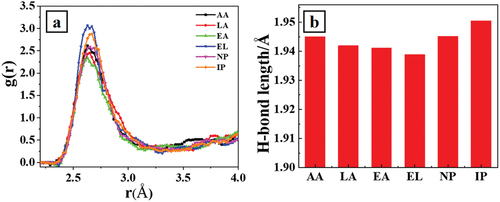
Figure 5. A is a representative radial distribution function of calculated Xiaoqu Baijiu with same concentration of six aroma substances addition. presents the corresponding average hydrogen bonds length of the samples in . AA, LA, EA, EL, NP and IP stand for acetic acid, lactic acid, ethyl acetate, ethyl lactate, n-propanol and isopentanol, respectively.
Data availability statement
The data that support the findings of this study are available from the corresponding author upon reasonable request.