Figures & data
Figure 1. The newly developed personal bioaerosol sampler PAS-4.
Figure 2. The newly developed personal bioaerosol sampler PAS-5.
Figure 3. Schematic of the LRRI large wind tunnel facility.
Figure 4. The experimental setup of the test personal bioaerosol samplers mounted on an adult manikin in the test chamber of the wind tunnel (manikin 90° to the wind).
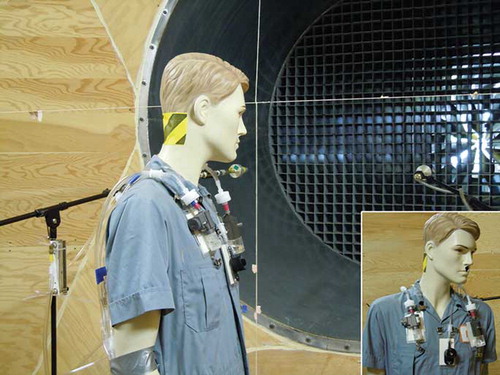
Figure 5. The aspiration efficiency as a function of the aerodynamic diameter of the test aerosols in different sampling orientations with the sampler inlet facing (a) 0° against the wind, (b) 90° to the wind, and (c) 180° to the wind.
Figure 6. The orientation-averaged aspiration efficiency as a function of the aerodynamic diameter for the two test personal bioaerosol samplers (PAS-4 and PAS-5) and the reference sampler (IOM): (a) U = 0.5 m/sec, and (b) U = 2.0 m/sec. Error bar represents the standard deviation of the mean.
Figure 7. The orientation-averaged collection efficiency of the two test bioaerosol samplers at different wind speeds: (a) PAS-4 and (b) PAS-5. Error bar represents the standard deviation of the mean.
Figure 8. The orientation-averaged capture efficiency, wall loss, and filter collection of the test personal bioaerosol samplers at different wind speeds: (a) PAS-4 and (b) PAS-5. (Errors represent the standard deviation of the mean.)