Figures & data
Figure 1. Map showing the 50 monitoring sites, land use categories, highways, railway, and Ministry of Environment (MOE) monitoring station in London, ON.
Table 1. Categories and corresponding variables considered for inclusion in the LUR model
Table 2. LUR model and cross-validation results for NO2 based on 50 monitoring locations (R 2 = 0.784; adjusted R 2 = 0.760)
Figure 2. (a) Observed versus predicted NO2 concentrations based on final LUR model. (b) Observed NO2 versus standardized residuals from LUR model.
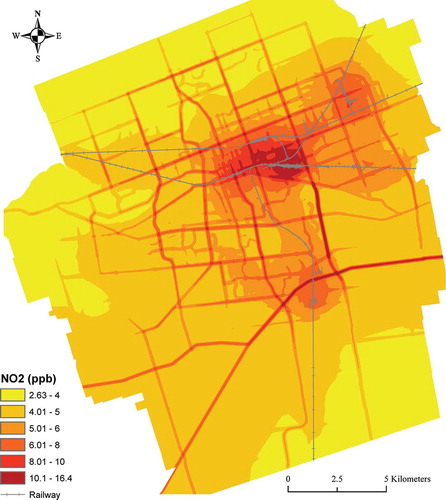
Figure 3.LUR model surface for NO2 in London, Ontario.