Figures & data
Table 1. Descriptive statistics of seven yearly data sets (2007–2014) used for investigation
Figure 1. Temporal changes in the daily average concentrations of PM10 and AT for the years 2007–2014.
Figure 2. A schematic diagram of the use of PCA to determine most significant lags to feed ANN.
Figure 3. Template structure of ANN models for daily PM10 estimates.
Table 2. Performance measures used in the model evaluations
Table 3. PCA results of PM10t against the lagged variables in the data set
Table 4. Structures of identified seasonal and nonseasonal ANN models
Table 5. Performance measures obtained from seasonal and nonseasonal models
Figure 4. Training and testing performance plots of ANN models: (a) NN_W1, (b) NN_S1, (c) NSNN1.
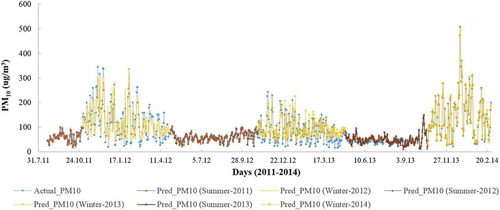
Figure 5. Estimates in training and testing stage of the models NN_W1 and NN_S1 against to actual data.
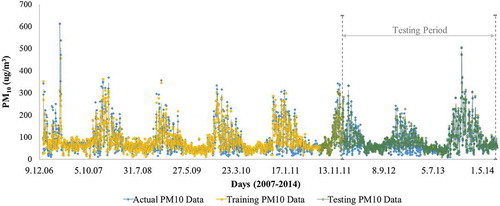
Figure 6. Testing estimates of NN_W1 and NN_S1 models for seasons in sequence.