Figures & data
Figure 1. Navajo homestove with firebox dimensions.
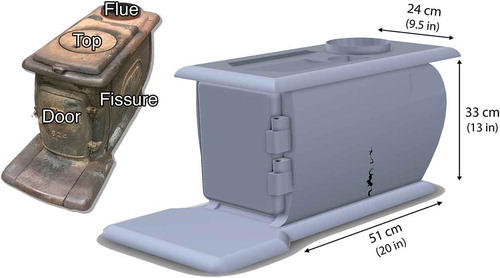
Table 1. Reported characterization and heating values of fuels tested (% dry-basis and BTU/lb).
Figure 2. Schematic of CUEST experimental facility.
Figure 3. Overview of phases and equations for mEFi and eEFi, where i = PM2.5, OC, EC, CO, and CO2.
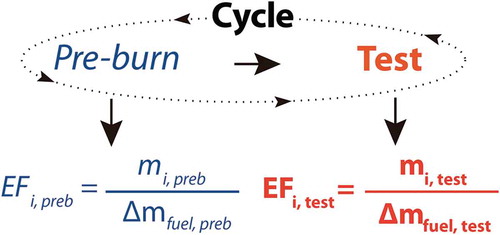
Table 2. Test phase conditions.
Table 3. Mass emission factors, mEFi (in g/kg), for PM and other compounds emitted during the test phase.
Table 4. Energy emission factors, eEFi (in mg/MJ) for cycle.
Figure 4. PM2.5 and CO EFs for (a) Test phase with natural log–transform and linear fit for mEFs, and (b) Pre-burn and Test phases combined (Cycle) with linear fit for eEFs. The shaded region in (a) is EPA-suggested PM10 and CO mass emission factors for a conventional residential wood stove (EPA, 1996). The vertical dashed lines represent mEFs and eEFs previously reported for these fuels and summarized in Tables S3 and S5.
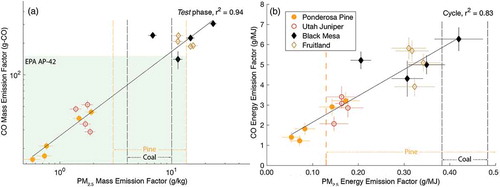
Figure 5. Elemental and organic carbon profiles during Test phase for (a) ponderosa pine, (b) Utah juniper, (c) Black Mesa, and (d) Fruitland.
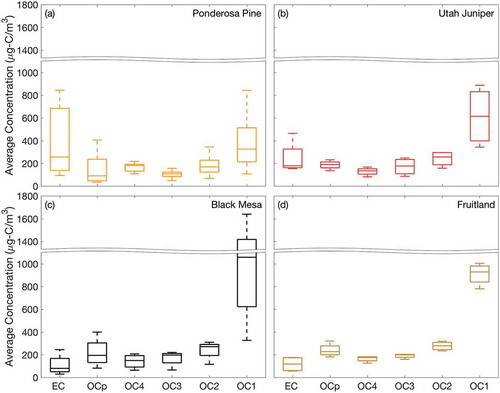
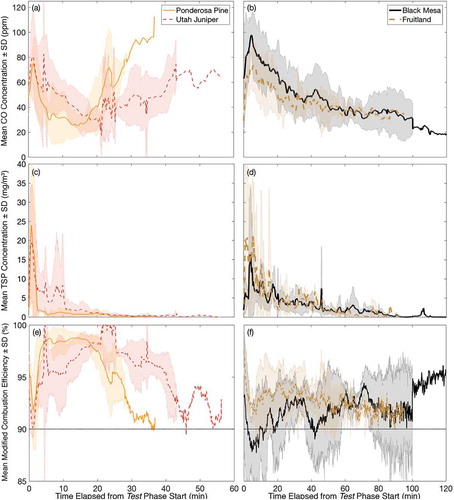
Figure 6. Real-time Test phase (a, b) CO and (c, d) TSP concentrations and (e, f) MCE: mean concentration (solid line) or percent efficiency (dashed line). Standard deviation of all Test phases for each fuel is plotted as shaded region. Dotted line in each MCE plot represents transition from flaming to smoldering combustion (90%).