Figures & data
Figure 1. The location and type of the 15 weather and climate disasters in 2016 with losses exceeding $1 billion (NCEI Citation2017).
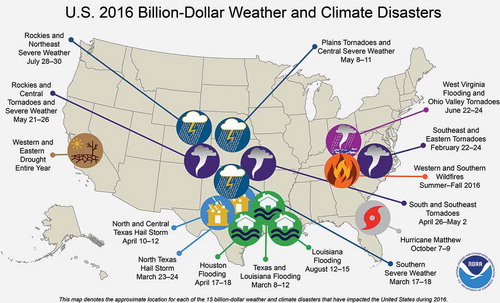
Figure 2. Time series showing the number (bar height) and type (bar color) of billion-dollar weather and climate disasters in the United States since 1980. The gray line shows total annual costs. The black line shows the running 5-year average. All cost lines CPI-adjusted to 2016 dollars (NCEI Citation2017).
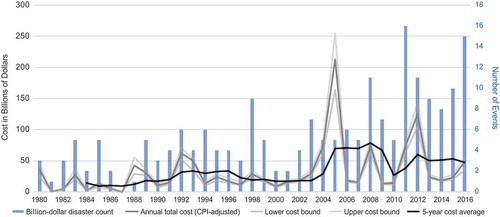
Figure 3. Annual percentage of the United States with maximum temperatures (upper graph) and minimum temperatures (lower graph) much above normal (upper 10th percentile; red) and much below normal (lower 10th percentile; blue). Updated from Gleason et al. (Citation2008).
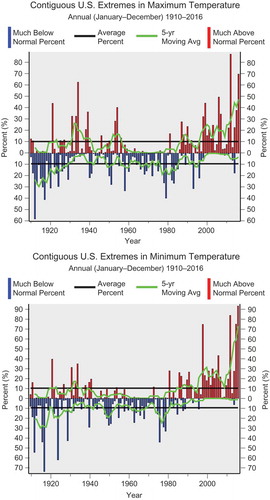
Figure 4. Annual time series (1895–2016) of heat-wave index averaged over United States. Heat-wave events are defined as 4-day periods with the average temperature exceeding the threshold for a 1-in-5-years recurrence interval. The heat-wave time series is dominated by the events of the 1930s. The heat during this period was exacerbated by severe drought and poor land management practices, which denuded large areas of vegetation in the Great Plains. Thus, the normal cooling afforded by transpiration from vegetation was largely absent. The period from the mid 1950s through the 1970s was characterized by a very low number of events. Since then, there has been a gradual increase in the number of events. Over the past 10 years, values have been near to above normal. Bold horizontal line at 0.20 indicates the long-term average. Figure inset shows the trend in heat-wave index over the United States during 1950–2016. (Data source: NOAA’s NCEI.)
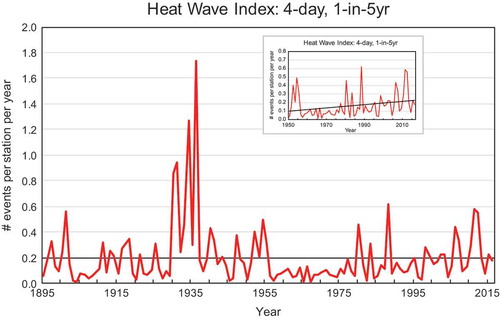
Figure 5. Annual time series (1895–2016) of cold-wave index averaged over United States. Cold-wave events are defined as 4-day periods with the average temperature being less than the threshold for a 1-in-5-years recurrence interval. The cold-wave time series exhibits high year-to-year variability. This reflects the occasional occurrence of intensely cold air masses usually originating in Siberia that affect large swaths of the United States. The large area covered by these infrequent events dominates the time series. The intense cold causes a wide range of severe impacts. A key feature of this time series is the rather low values since the mid 1990s. Since then, there have been no cold waves with the intensity and areal coverage that are characteristic of the historic cold waves in the earlier record. Bold horizontal line at 0.20 indicates the long-term average. Figure inset shows the trend in cold wave index over the United States during 1895–2016. (Data source: NOAA’s NCEI.)

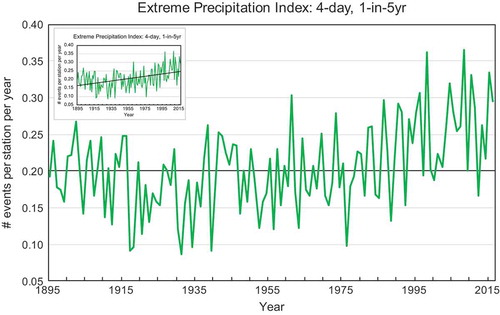
Figure 6. Annual time series (1895–2016) of extreme precipitation index averaged over United States. Extreme precipitation events are defined as rainfall accumulations over 4-day periods exceeding the threshold for a 1-in-5-years recurrence interval. Bold horizontal line at 0.20 indicates the long-term average. Figure inset shows the trend in extreme precipitation over the United States during 1895–2016. (Data source: NOAA’s NCEI.)