Figures & data
Figure 1. Individual node model.
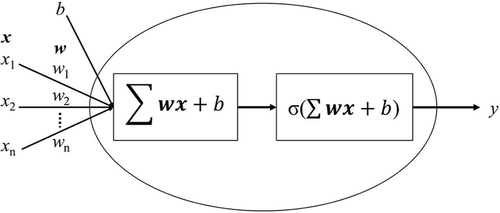
Table 1. Common activation functions.
Figure 2. Different ANN model architectures: (a) simple feed-forward neural network, (b) a recurrent (Elman) neural network, and (c) a deep feed-forward neural network with multiple hidden layers.
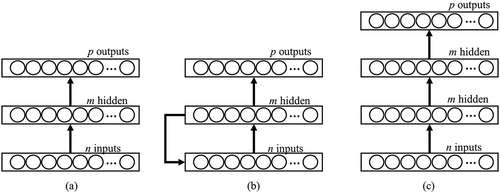
Figure 3. Correlogram of O3 and NOx for 72 hr.
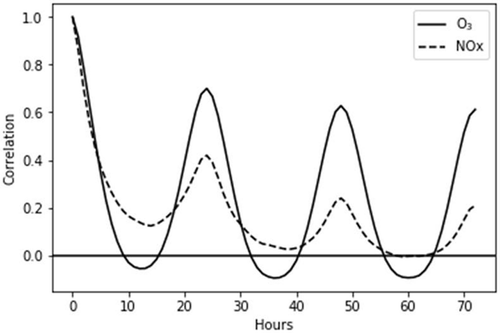
Figure 4. Architecture of an RNN showing layers unfolding in time.
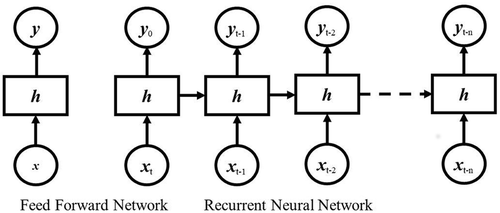
Table 2. Enhanced first-order optimizers used for DL.
Figure 5. LSTM architecture showing unit time delays (−1), gates, and recurrentactivation functions (σ).
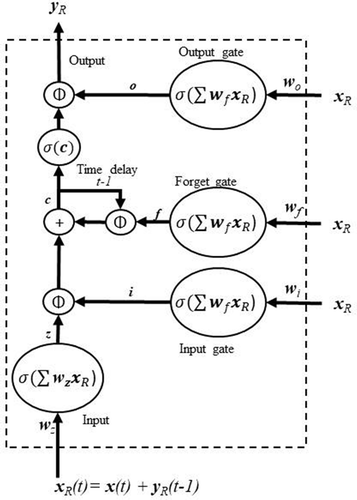
Figure 6. Location of Kuwait and Air Monitoring Station used in the study.
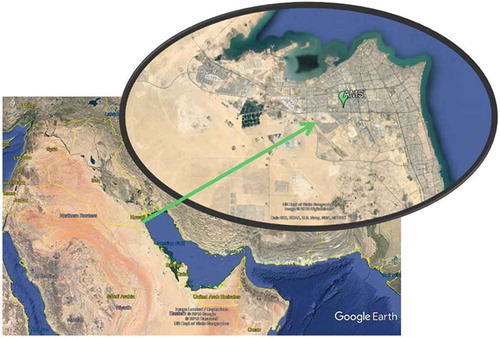
Table 3. Chemical and meteorological parameters captured at the Air Monitoring Station.
Figure 7. Station wind rose from 2012 to 2014.
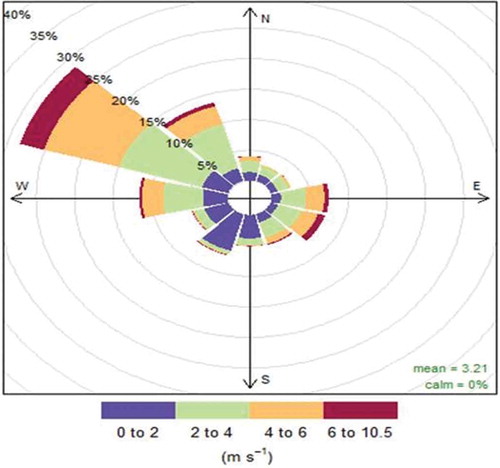
Figure 8. Seasonal bivariate polar plots of 1-hr O3.
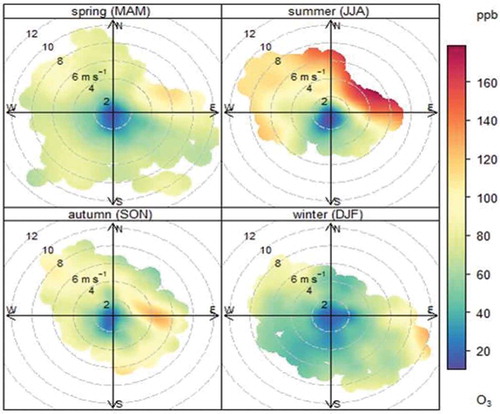
Figure 9. Hourly averages of 1-hr O3 and NOx.
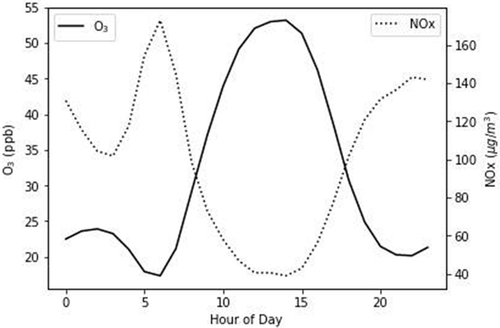
Figure 10. RMSE of O3 and NOx from consecutive gaps of data using the first imputation method.
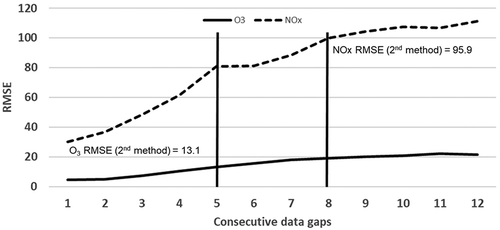
Figure 11. Feature importance from decision tree prediction of 8-hr O3 exceedances from 1 hr to 12 hr.
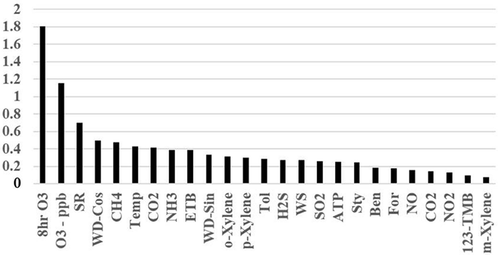
Figure 12. Process of converting data input columns into a tensor for training the RNN.
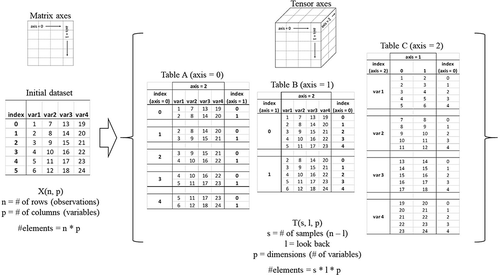
Figure 13. Loss function errors for training and test data sets for different horizons at (a) 24 hr, (b) 36 hr, and (c) 48 hr.
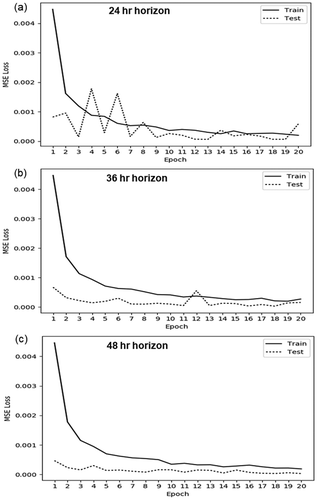
Figure 14. Results of training an RNN with a 24-hr horizon.
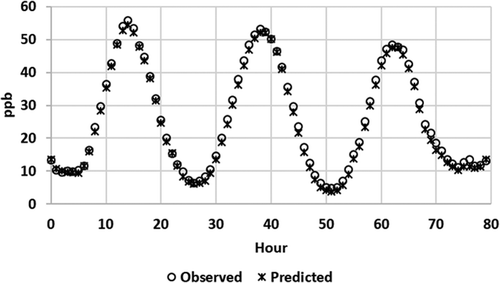
Figure 15. Distribution of residual test errors for 24-hr horizon network.
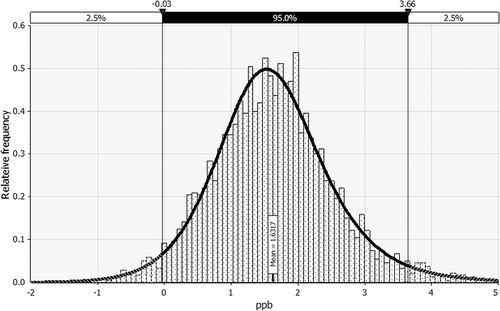
Figure 16. Training error associated with feature reduction on network prediction.
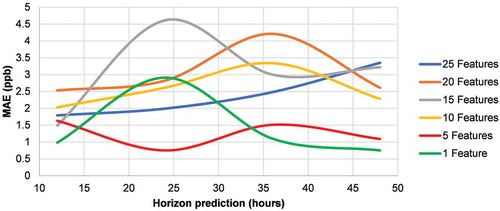
Table 4. Default values for parameter sensitivity analysis.
Figure 17. Prediction horizons using five features and default parameters.
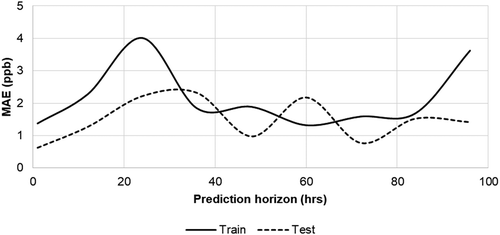
Figure 18. Impact of (a) batch samples, (b) look-back nodes, and (c) dropout factor parameters on training errors in the model.
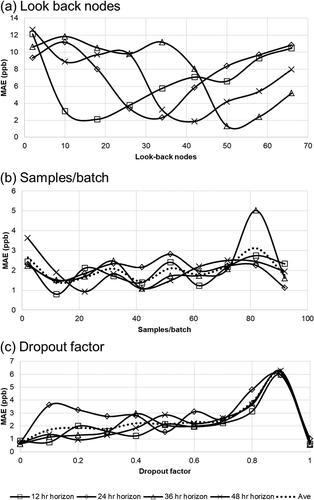
Table 5. Comparison of RNN test data results to previously published results.
Table 6. Comparison of different forecasting errors over a 24-hr period.
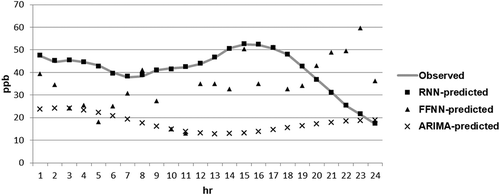
Figure 19. Comparison of different model forecasts over a 24-hr period.