Figures & data
Table 1. Primers, probes, and protocols used for qPCR quantification of selected microorganisms.
Table 2. Primers used for Illumina amplification.
Figure 1. Concentrations of Penicillium/Aspergillus spp. (Pen-Asp) in the air at sampling sites from both biomethanization facilities during summer and winter. The Storage site was not sampled during winter due to cold temperatures. The detection limit was 3 × 101 Pen-Asp/m3.
Figure 2. Concentrations of Aspergillus fumigatus spores in the air at sampling sites from both biomethanization facilities during summer and winter. The Storage site was not sampled during winter due to cold temperatures. The detection limit was 5 × 101 A. fumigatus/m3.
Figure 3. Rarefaction curves obtained from the number of observed OTUs and the sequences per sample for air samples from the two biomethanization facilities visited. An average of the OTUs observed in each sample was calculated for all the samples (±1 standard deviation).
Figure 4. Comparison of species richness estimator Chao1 index values from air samples from two biomethanization facilities collected during summer and winter. Statistical significance shown was by Mann-Whitney U test analyses.
Figure 5. Principal coordinates analysis of air samples taken from two different biomethanization facilities visited during summer and winter. (a) Samples colored according to the season (winter in blue and summer in red). (b) Samples colored according to the facility visited (BF1 in blue and BF2 in red).
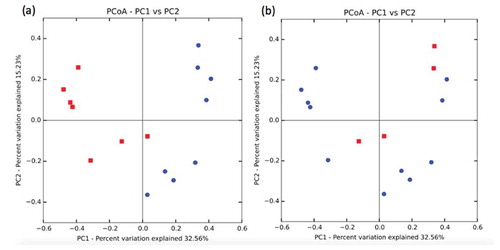
Figure 6. Average relative abundances of fungal classes in air samples collected from two different biomethanization facilities visited during summer and winter.
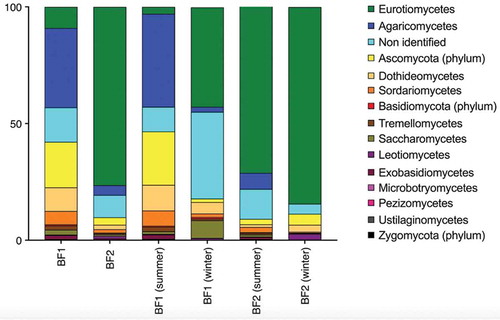
Figure 7. Venn diagram showing the 20 most abundant genera of fungi identified in air samples from BF1 during summer and during winter and those present during both seasons. The numbers are percentages of relative abundance. In the middle section, percentages of relative abundance of each fungus in summer and winter are separated by a vertical bar.
Figure 8. Venn diagram showing the 20 most abundant genera of fungi identified in air samples from BF2 during summer and during winter and those present during both seasons. The numbers are percentages of relative abundance. In the middle section, percentages of relative abundance of each fungus in summer and winter are separated by a vertical bar.