
Figures & data
Table 1. Existing LCIA methods/models for assessing human health impact.
Table 2. Classification of unit processes (based on ACC LCI; American Chemistry Council Citation2011) .
Figure 1. The system boundary of cradle-to-gate MDI production (modified from American Chemistry Council Citation2011).
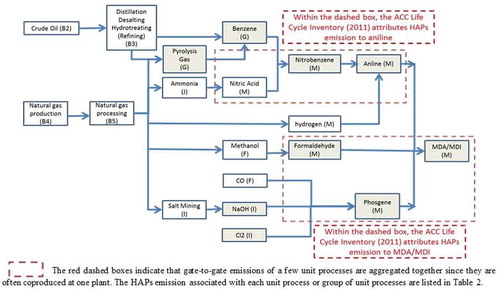
Table 3. Unit processes and site-specific modeling/average stack parameters (EPA Citation1999a) .
Figure 2. Census tract–level inhalation risks of site-specific unit processes (left: cancer risk; right: noncancer HI).
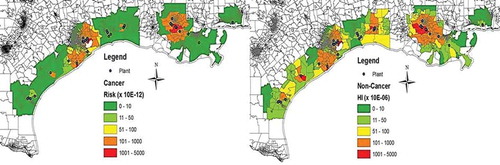
Figure 3. County-level average inhalation risks of site-specific unit processes (left: cancer risk; right: noncancer hazard index).
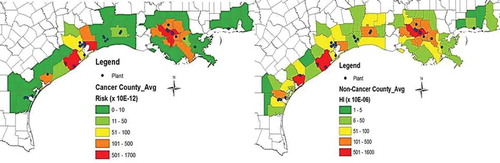
Figure 4. Distribution of inhalation risks associated with site-specific unit processes at the county level (left: cancer risk; right: noncancer hazard index).
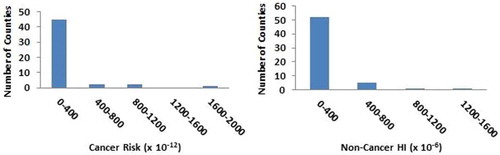
Table 4. Production capacities of chemical plants in relatively high risk areas.
Figure 5. Site-specific plant locations and high cancer risk areas.
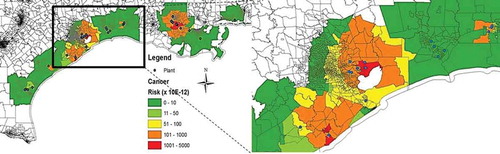
Figure 6. Site-specific plant locations and high noncancer hazard index areas.
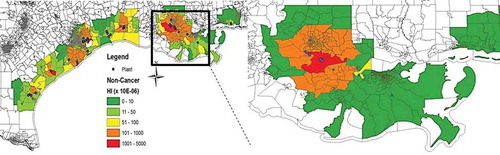
Table 5. Inhalation risks of unit processes without exact location (HAPs emitted to the continental air compartment).
Figure 7. Inhalation risks by HAPs for non-site-specific unit processes.
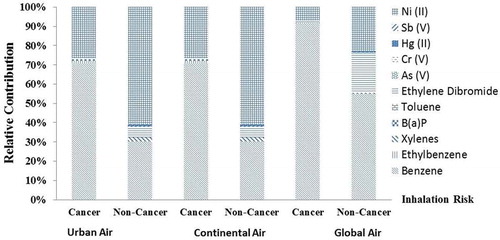
Table 6. County-level inhalation risk statistics (AERMOD).
Table 7. Inhalation risks of site-specific unit processes (if using USEtox) (assuming that HAPs were emitted to the urban air compartment).
Table 8. Inhalation risks of non-site-specific unit processes (assuming that HAPs were emitted to the urban air compartment).
Figure 8. Relative contributions of unit processes to inhalation risks.
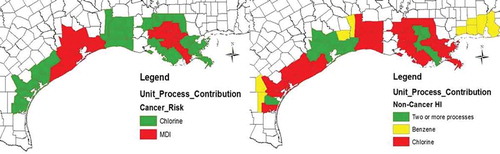
Table 9. Mass distributions of HAPs in different environmental compartments.