Figures & data
Table 1. A summary of the publicly available PM2.5 exposure datasets.
Figure 1. County-level maps of annual mean PM2.5 in 2011 using: (a) CDC WONDER, (b) EPHTN, (c) Dalhousie data (V4.NA.02), and (d) EPA AQS and IMPROVE fused data. White spots on the map represent “no data available”.
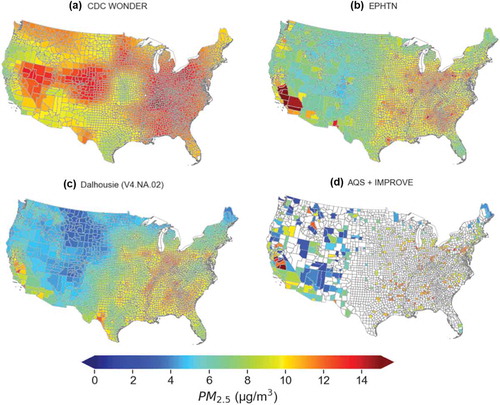
Table 2. Summary of county-average 2011 annual mean PM2.5 estimates of AQS+IMPROVE fused data, CDC WONDER, EPHTN and Dalhousie data in contiguous U.S.
Figure 2. Scatter plots of publicly available surface PM2.5 datasets – (a) CDC WONDER, (b) EPHTN, and (c) Dalhousie (V4.NA.02) versus AQS+IMPROVE fused data. All data represent county-average 2011 annual mean. Two linear regressions are calculated: one for all data (top text box, red solid line showing this fit) and one for PM2.5 < 15 μg m-3 only (bottom text box). Black solid line stands for 1:1 line. The value of a and b represent intercept and slope of the linear regression, respectively. The ±1σ stands for ± one standard deviation. The number of samples used for linear regression in (a), (b) and (c) are 543, 544 and 544, respectively.
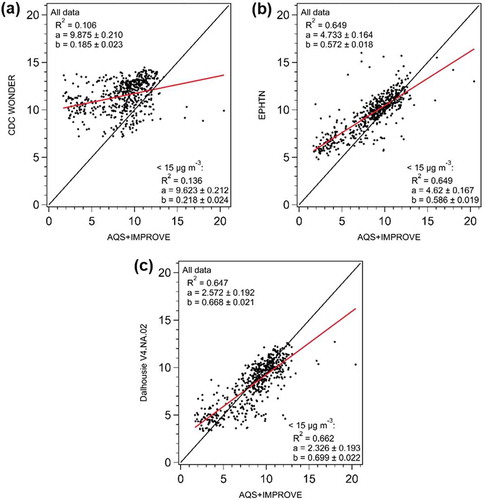
Figure 3. (a) Frequency distributions of the county-average 2011 annual mean PM2.5 mass concentrations for the four data sets shown in . (b) Mean (triangles), median (horizontal bar in the middle), 25 and 75 percentiles (bottom and top of the box, respectively) for the four data sets. Black dots represent outliers.
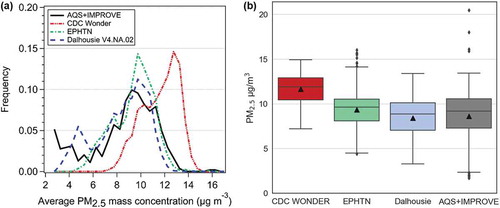
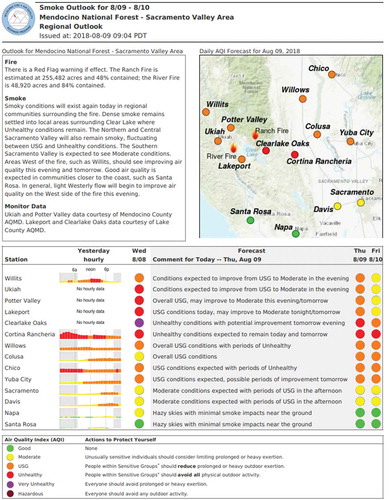
Figure 4. An example of a smoke forecast issued for local communities by the Wildland Fire Air Quality Program. Example is from the river fire and ranch fire in the mendocino national forest issued for portions of Northern California and the Sacramento Valley area, California on August 9, 2018.