
Figures & data
Figure 1. The annual average pH distribution of precipitation in China in 2017.
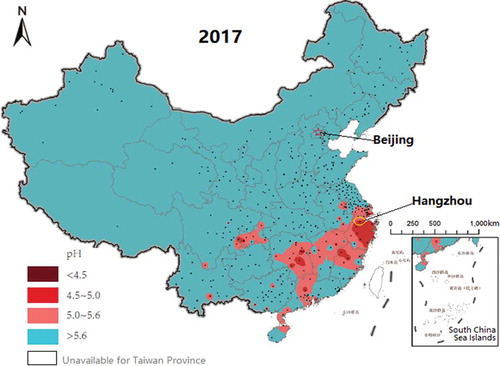
Figure 2. Map of the study area and sampling site.
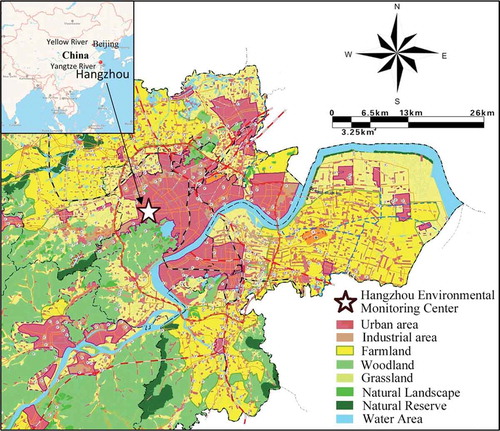
Table 1. Seasonal variation of rainwater chemistry in Hangzhou.
Figure 3. Seasonal variation of rainwater pH and rainfall in Hangzhou from June 2008 to June 2009.
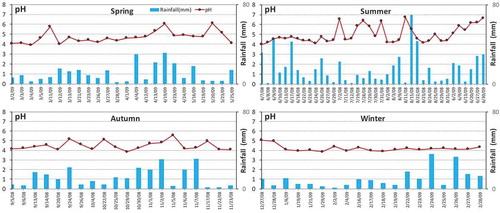
Figure 4. The variations of concentration and acid buffering capacity of PM10 and TSP during three stages.
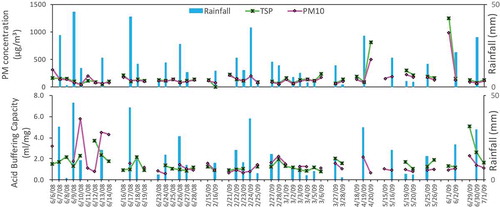
Table 2. Seasonal average concentration of TSP and PM10 and the chemical data during non-rainy days (-NR) and rainy days (-R) (μg/m3).*.
Figure 5. Variations of chemical compositions in PM10.
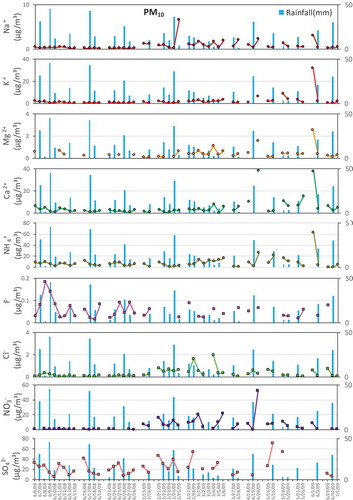
Figure 6. Variations of chemical compositions in TSP.
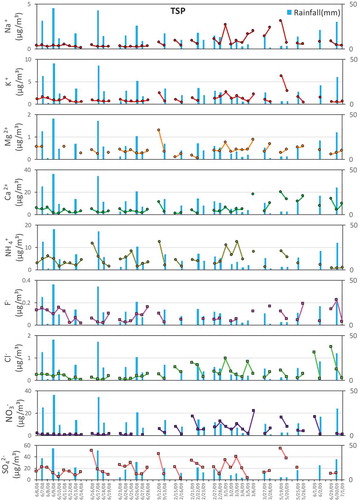
Table 3. Correlation coefficient among soluble ions present in rainwater and PM in Hangzhou.
Table 4. Enrichment factors for rainwater components relative to the seawater.
Table 5. Principal component analysis of ionic compositions in Hangzhou rainwater from June 2008 to June 2009.