
Figures & data
Table 1. Descriptions of the outdoor wood boilers used in this study.
Figure 1. Examples of recorded IWS and OWHH stack wall and outside temperature time series.
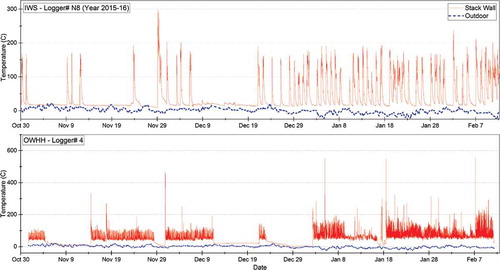
Figure 2. Typical OWHH stack temperature profile.
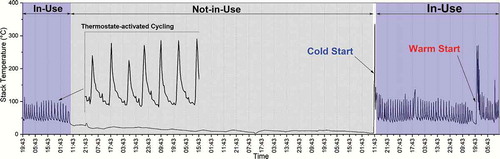
Figure 3. An example of the result from the OWHH cycle-identification algorithm.
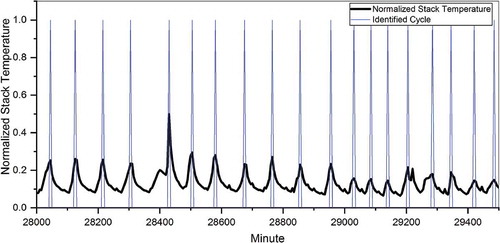
Figure 4. Typical IWS stack temperature profile with active and inactive operating modes.
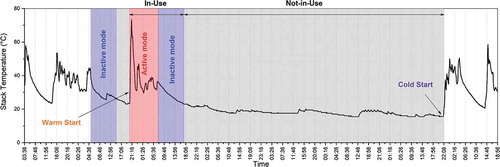
Table 2. Descriptions of the indoor wood stoves (IWSs) used in the study.
Table 3. Usage pattern of the studied OWHHs.
Figure 5. Correlations between weekly heating degree days and number of identified warm starts in OWHHs.
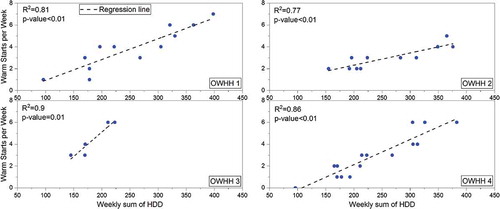
Figure 6. Correlations between the daily number of boilers cycles and heating degree days.
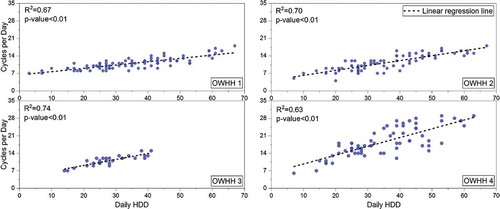
Figure 7. The overall fraction of usage modes for IWSs.
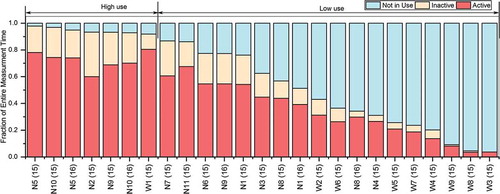
Figure 8. Comparison of usage patterns of NYS and WA stoves in February 2015.
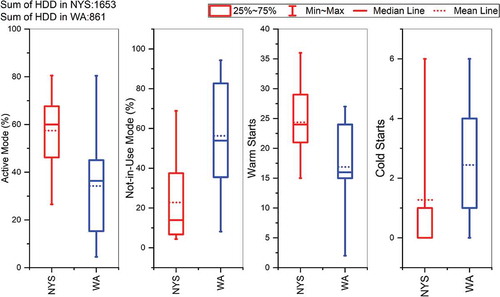
Figure 9. Ranges of warm start event frequency and continuous active mode duration for IWSs.
Figure 10. Relationship between the share of inactive mode and warm and cold starts.
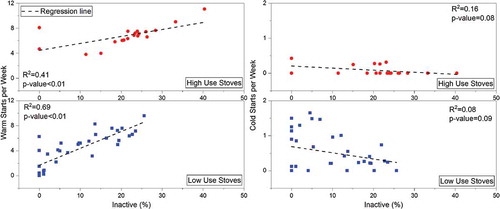
Figure 11. Relationship between the weekly sum of heating degree days and frequency of warm start events.
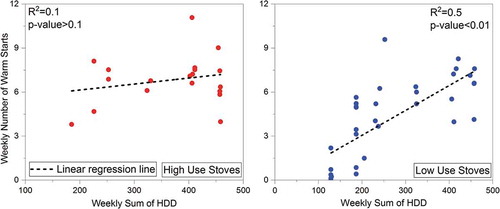
Figure 12. Correlation between the share of active mode and the mean duration of continuous active periods.
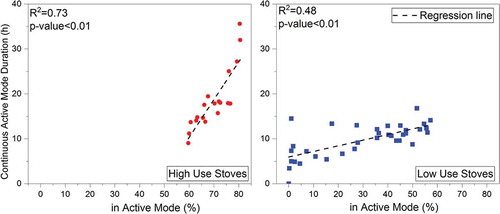
Table 4. Average usage patterns of the stoves in NYS with two years of measurement.
Table 5. Weekday/weekend analysis of IWS in-use modes.