Figures & data
Figure 1. Geometric characteristics of the simulation segment.
Figure 2. Percentage changes of emissions and fuel consumption with respect to CACC MPR (tc = 0.6 sec and ta = 1.1 sec).
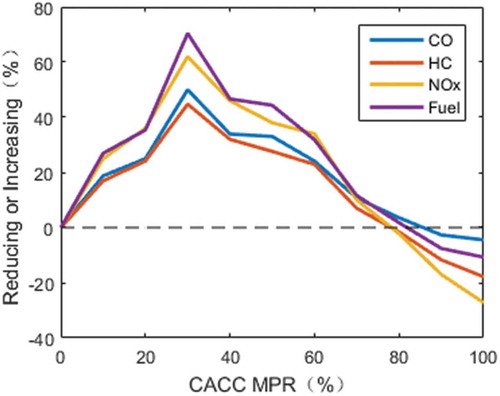
Figure 3. The parametric sensitivity analysis on tc (ta = 1.1 sec) of emissions and fuel consumption: (a) tc = 0.9 sec, (b) tc = 1.1 sec.
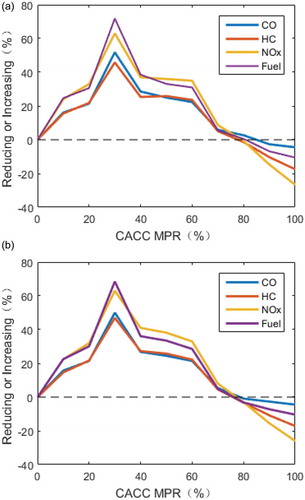
Figure 4. The parametric sensitivity analysis on ta (tc = 0.6 sec) of emissions and fuel consumption: (a) ta = 1.6 sec, (b) ta = 2.2 sec.
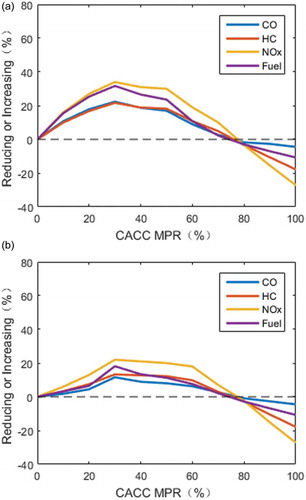
Figure 5. Stability of MDV.
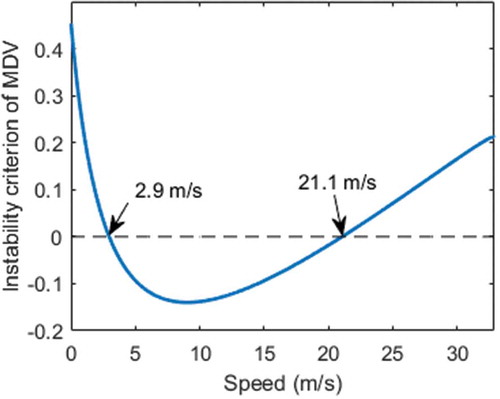
Figure 6. Stability chart of the mixed traffic flow (tc = 0.6 sec and ta = 1.1 sec).
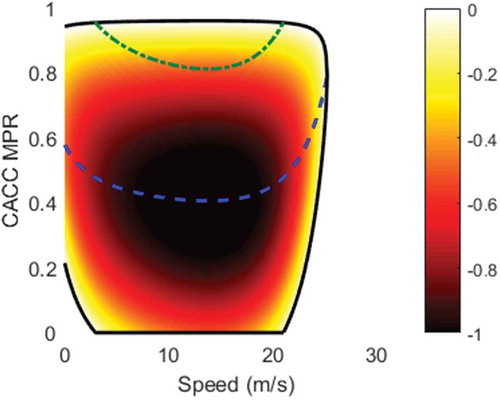
Figure 7. Stability chart of the mixed flow with parametric sensitivity analysis on tc (ta = 1.1 sec): (a) tc = 0.9 sec, (b) tc = 1.1 sec.
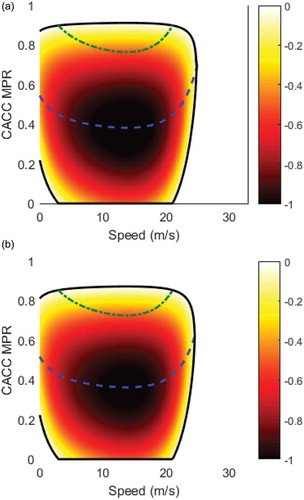
Figure 8. Stability chart of the mixed flow with parametric sensitivity analysis on ta (tc = 0.6 sec): (a) ta = 1.6 sec, (b) ta = 2.2 sec.
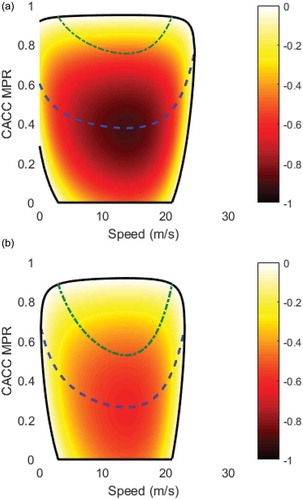
Figure 9. Stability chart of mixed CACC flow with V2 V communication environment.
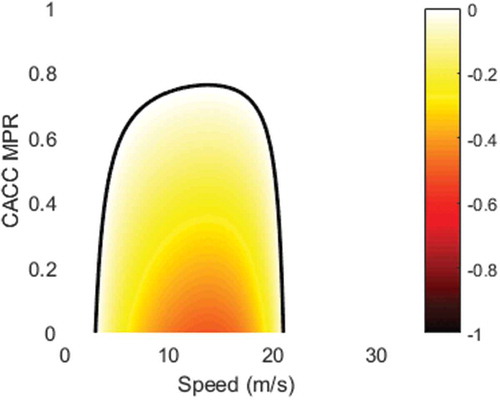
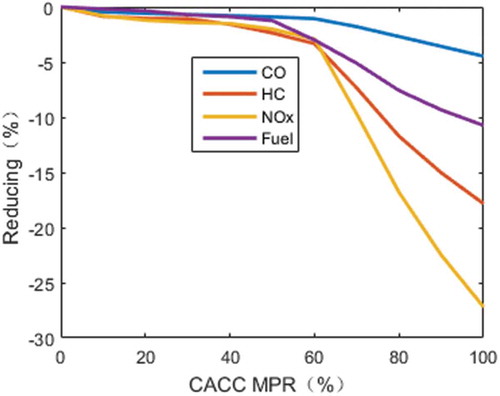
Figure 10. Trend impact of CACC MPRs on emissions and fuel consumption with V2 V communication environment.