Figures & data
Table 1. Structure of the perforated plate
Figure 1. Schematic and picture of the duct system

Table 2. Dimensions of the lab-scale electrostatic precipitator
Figure 2. Pictures of the lab-scale electrostatic precipitator
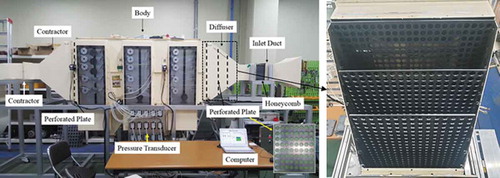
Figure 3. Schematic diagram of the diffuser, perforate plate and sampling grid
Table 3. Duct test results depending on the number of holes of the perforated plate with a thickness of 5 mm and a porosity of 50%
Table 4. Duct test results depending on the number of holes of the perforated plate with a thickness of 5 mm and a porosity of 40%
Table 5. Duct test results depending on the number of holes of the perforated plate with a thickness of 5 mm and a porosity of 30%
Figure 4. Discharge coefficient depending on the number of holes in the perforated plate with a thickness of 5 mm
Table 6. Duct test results depending on the plate thickness with a porosity of 50% and 0.104 holes/m2 plate area
Figure 5. Discharge coefficient depending on the porosity of the perforated plate with a thickness of 5 mm and 0.104 hole/m2 plate area
Figure 6. Discharge coefficient depending on the thickness of the perforated plate with a porosity of 50% and 0.104 hole/m2 plate area
Figure 7. Velocity distribution without the perforated plate (a) and with one perforated plate
Table 7. Summary of velocity distribution with two perforated plates at the interval of less than 0.2 m
Figure 8. Velocity distribution with two perforated plates at the interval of less than 0.2 m
Table 8. Summary of velocity distribution with two perforated plates at the interval exceeding 0.2 m
Figure 9. Velocity distribution with two perforated plates at the interval exceeding 0.2 m
Table 9. Summary of velocity distribution by adding the 1st perforated plate to DF and CE configurations, respectively
Figure 10. Velocity distribution by adding the 1st perforated plate to DF and CE configurations, respectively
Table 10. Summary of velocity distribution by adding the 2nd perforated plate to AF and AE configurations, respectively
Figure 11. Velocity distribution by adding the 2nd perforated plate to AF and AE configurations, respectively
Table 11. Summary of velocity distribution by adding the 3rd perforated plate to AB and BD configurations, respectively
Figure 12. Velocity distribution by adding the 3rd perforated plate to AB and BD configurations, respectively