
Figures & data
Table 1. General description of the sampling homes
Table 2. Number and percentage of indoor cooking activities by influential factors
Table 3. Duration of cooking activities by influential factors
Figure 1. Ventilation conditions during cooking or within 15 minutes after cooking ended, by season
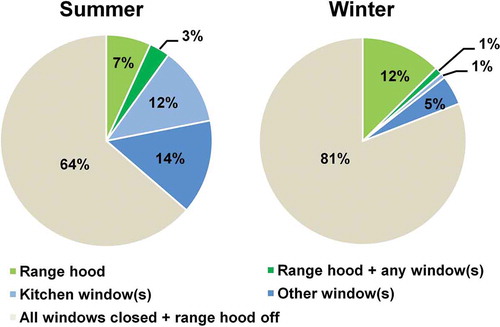
Figure 2. The timing of turning on and off a range hood due to cooking
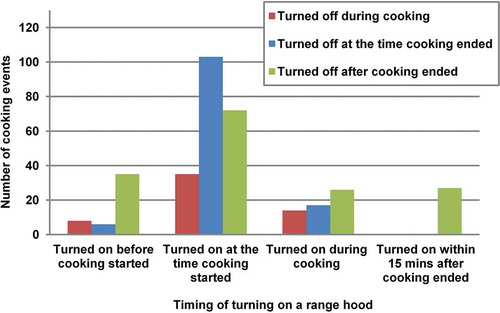
Figure 3. The timing of opening and closing the windows related to cooking episodes
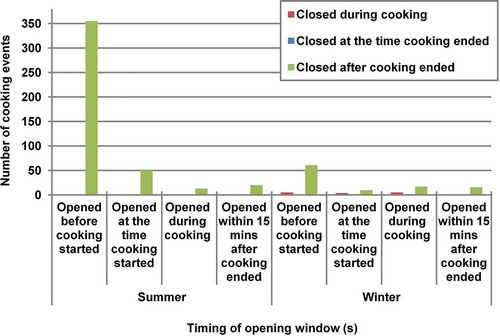
Table 4. Estimated PM2.5 decay rates by ventilation condition
Table 5. Estimated PM2.5 decay rates by home construction year, under the condition of no range hood use and all windows closed
Table 6. Estimated PM2.5 source strengths and emission masses by cooktop fuel type and cooking method/device
Table 7. Exposure estimates for a person in the living or family room to PM2.5 due to cooking