Figures & data
Figure 1. City of Santiago de Chile with the monitoring stations (white dots). The inset shows the location of the station inside the park; 580 m to the left there is a horse race track, 400 m to the right there is a highway
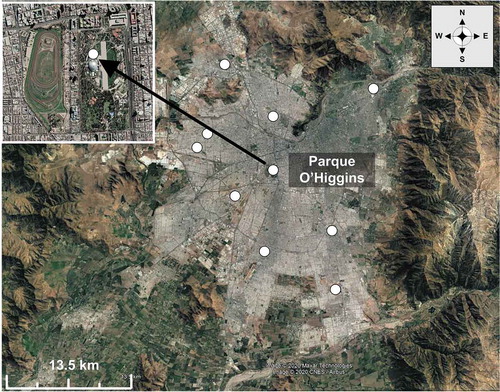
Figure 2. (a) Annual PM10 and PM2.5 concentrations. (b) Annual PM2.5 concentrations for fall/winter and spring/summer. (c) Annual PM10-2.5 and PM2.5 concentrations. (d) Annual PM10-2.5 concentrations for fall/winter and spring/summer
Figure 3. (a) Rainfall and (b) temperature measured in downtown Santiago from 1998 to 2018. The inset shows the average rainfall of the last and previous 9 years
Figure 4. (a) Concentration impact factor for weekdays for PM2.5 and PM10–2.5, (b) Monthly concentration impact factors. (c) Wind speed (WS, m/s), temperature (T, C), relative humidity (RH, %), and rain (Pp) CIFs. The error bars are the standard error
Figure 5. Concentration impact factor for the year effect for PM2.5 and PM10-2.5. The straight lines indicate an OLS regression lines to the data for each period. The error bars are the standard error
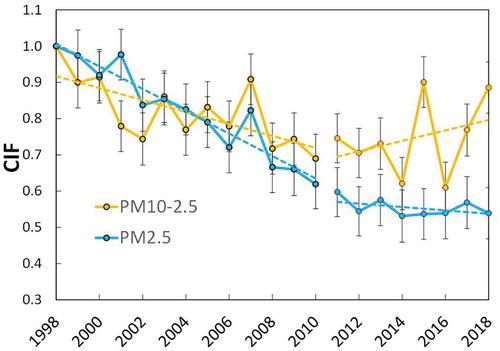
Figure 6. Hierarchical clustering and heat map for the relative contribution of elements in (a) PM2.5 and (b) PM10-2.5. The colors (Row Z Score) represent the number of standard deviations over (yellow) or below (blue) the median for each element
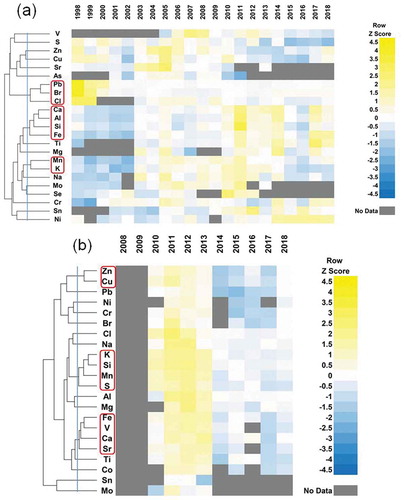
Figure 7. Yearly and monthly CIFs for the clustering groups in PM2.5. (a) yearly CIF for elements associated to the earth crust, (b) monthly CIF for elements associated to the earth crust, (c) yearly and (d) monthly CIFs for elements associated transport or wood burning, (e) yearly an d (f) monthly CIFs for elements associated to soil dust. The error bars are the standard error
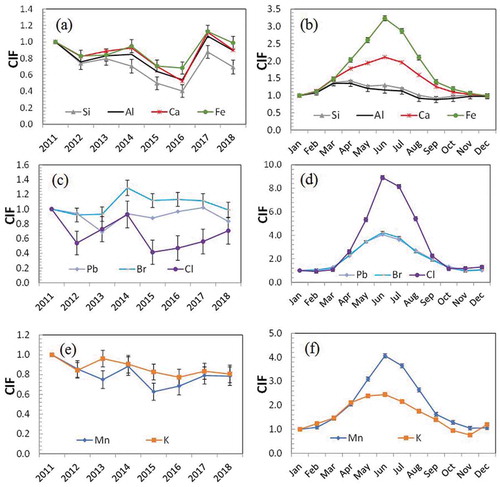
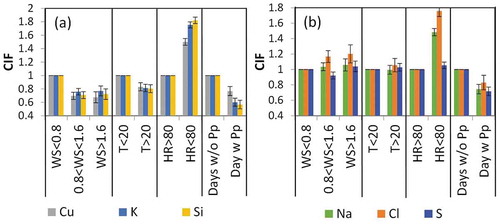
Figure 8. Wind speed (WS, m/s), temperature (T, C), relative humidity (RH, %), and rain (Pp) CIFs (a) for the crustal elements, (b) for Mn and K. The error bars are the standard error
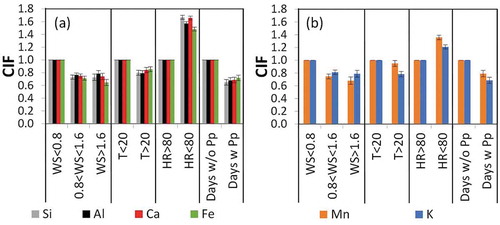
Figure 9. Yearly and monthly CIFs for the clustering groups in PM10-2.5. (a) yearly CIF for elements associated to brake wear, (b) monthly CIF for elements associated to the brake wear, (c) yearly and (d) monthly CIF for elements associated to the earth crust , (e) yearly and (f) monthly CIF for another group of elements associated to earth crust. The error bars are the standard error
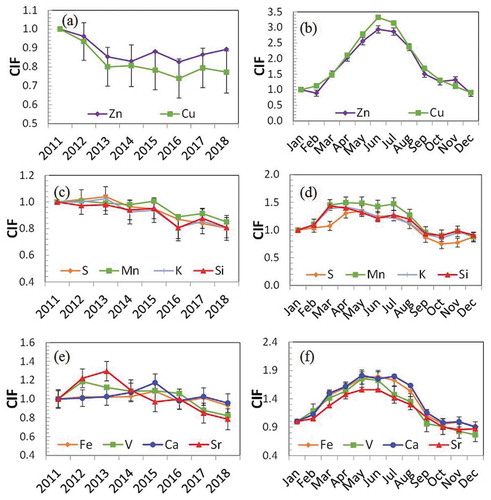
Figure 10. Wind speed (WS, m/s), temperature (T, C), relative humidity (RH, %), and rain (Pp) CIFs (a) for the crustal elements in PM10-2.5, (b) for Na, Cl, and S. The error bars are the standard error