Figures & data
Table 1. Low-cost sensor location and measurement dates
Figure 1. Locations of low-cost sensors and the Georgia Environmental Protection Division (EPD) monitoring site at Turner Elementary School in Albany, Georgia. The fourth low-cost sensor is collocated with EPD’s BAM

Figure 2. (a) Daily total burn area at the three low-cost sensor deployed (Dougherty, Lee, Worth) and nine surrounding counties according to the Georgia Forestry Commission (GFC) permit database and daily average PM2.5 concentration from the BAM at Albany (red); Permitted burns at the three low-cost sensor deployed counties (blue) and nine surrounding counties (gray) on b) March 9, c) March 10 and d) March 13, 2018. Red circles represent fires larger than 150 acres, orange circles represent fires larger than 50 acres and smaller than 150 acres; yellow circles represent fires smaller than 50 acres; Green circles represent low-cost sensors and the black star represents the Albany EPD site
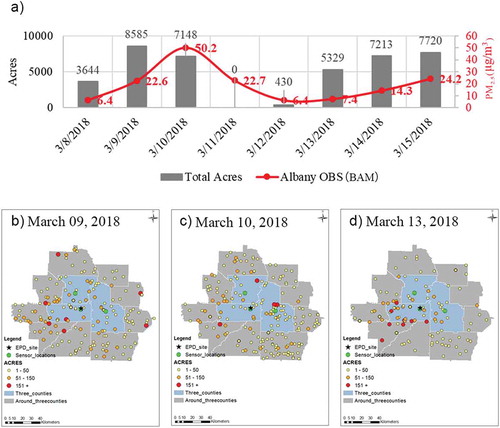
Table 2. Mean and standard deviation (SD) of hourly PM2.5 concentrations from the BAM at the Georgia EPD monitoring site in Albany and low-cost sensors during their measurement periods ()
Figure 3. Comparisons of daily PM2.5 concentrations between low-cost sensors and the BAM at Georgia EPD site in Albany from May 16, 2017 to June 20, 2018: a) Albany sensor (no data before March 14, 2018); b) Dougherty Comprehensive High School (DCHS) sensor; c) Worth County High School (WCHS) sensor (no data from May 09, 2018 to June 20, 2018); d) Lee County High School (LCHS) sensor (no data from July 28, 2017 to March 13, 2018 and April 21, 2018 to June 20, 2018)
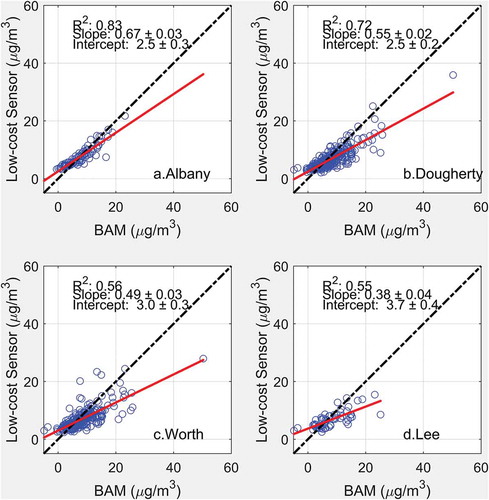
Figure 4. Comparisons between hourly observed and simulated PM2.5 concentrations, and the simulated fire impact on March 9–10, 2018 at a) Albany EPD site (BAM), and b) DCHS site (sensor); and c) Hourly wind speed observations at the Southwest Georgia Regional Airport (KABY) and simulations at KABY and Albany EPD site
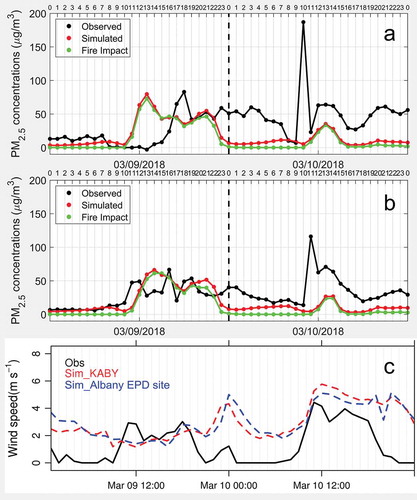
Figure 5. Spatial fields of hourly PM2.5 concentrations on March 13 from 11:00 to 16:00: Georgia EPD site in Albany (white dot), DCHS (green dot), WCHS (blue dot) and LCHS (red dot)
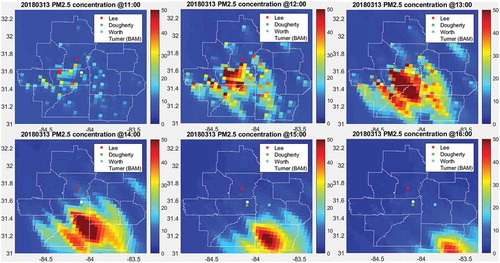
Figure 6. Comparisons of hourly PM2.5 observations at Albany EPD site (BAM), and at DCHS and WCHS sites (low-cost sensors) with PM2.5 simulations from CMAQ (a, b, c), full data fusion (DF) (d, e, f), and DF with data withholding (WH) (g, h, i). The red lines are the linear regression trendlines
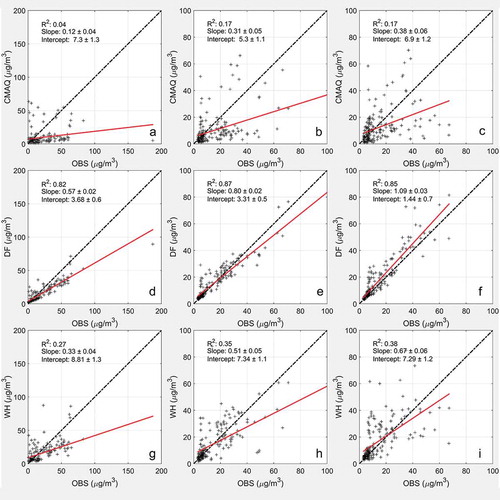
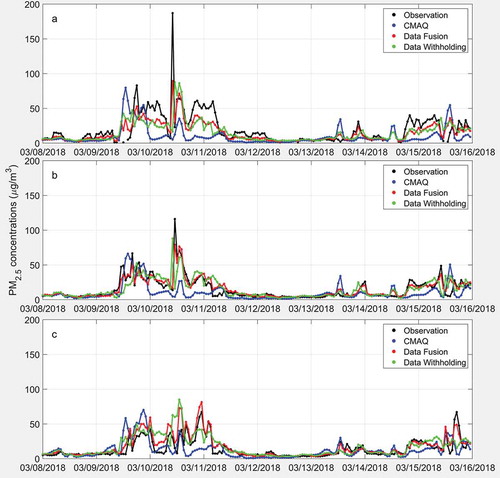
Figure 7. Hourly PM2.5 concentrations from observations (black lines), CMAQ simulations (blue lines), data fusion (red lines), and data fusion with data withholding (green lines) at a) Georgia EPD site in Albany, b) DCHS, and c) WCHS on March 8–16, 2018, EST