
Figures & data
Figure 1. Time-Aligning the DC and PM2.5 data.
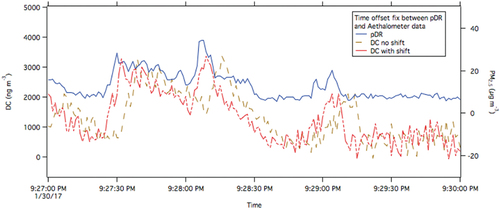
Figure 2. Aaebrc and AAEWB from RWC sources, including over 300 distinct plumes sampled in two heating seasons.
Figure 3. AAEbrc and AAEWB distributions for each RWC source location. Sources are placed in descending order based on median AAEBrC value.
Figure 4. (A) PM2.5 vs BC for TIOGA16 and TIOGA17. (b) the distribution of PM2.5/BC ratios. TIOGA16, prior to adopting clean burning techniques, shows greater PM2.5/BC values.
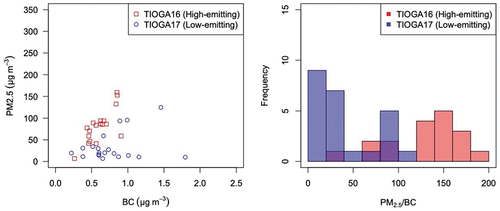
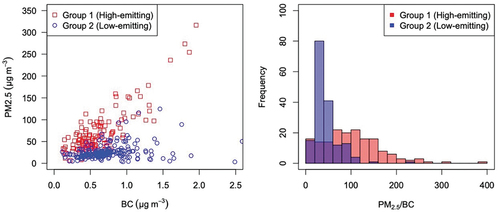
Figure 5. (A) PM2.5 vs BC plots for Group 1, high-emitting sources, and Group 2, low-emitting sources. (b) the distribution of PM2.5/BC ratios. Group 1, high-emitting sources, show steep PM2.5/BC values.
Supplementary_Materials_v2.pdf
Download PDF (158.3 KB)Data availability statement
The data that support the findings of this study are available from the corresponding author, Dr. K. Max Zhang, upon reasonable request.