Figures & data
Figure 1. Schematic of combustion test setup featuring locations of instrumentation, instrument flow requirements, and instrument groupings.
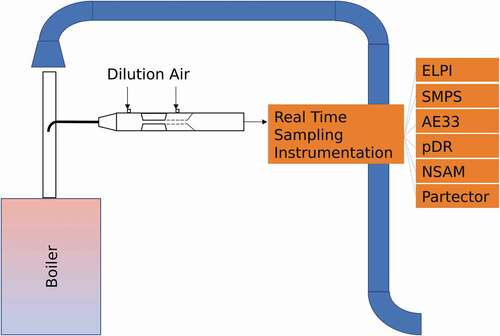
Table 1. Comparison of the US EPA certification and design parameters for the wood chip/pellet and cordwood hydronic heaters featured in this study.
Table 2. Summary of operating condition mean PNC (units of: C (concentration #/cm3)/dlog (particle size (dp)), PMC (units: milligram per cubic meter), and PSAC (units: square micrometers per cubic centimeter) results.
Table 3. Summary of PSD results from ELPI and SMPS for all three appliances across each of four operating conditions.
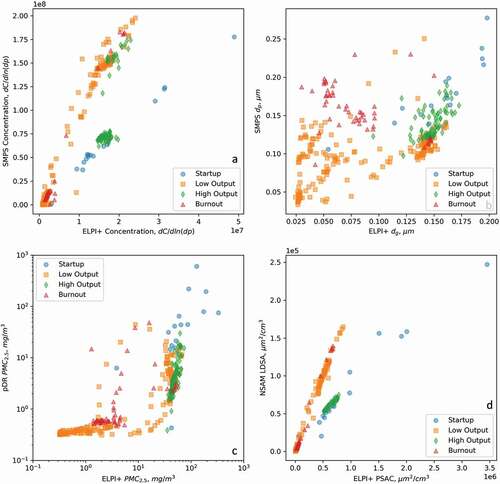
Figure 2. Scatterplot comparisons of data collected during testing of Appliance 1 over four different operating conditions: startup, low-output, high-output, and burnout. (A) PNC comparison between ELPI and SMPS. (B) Comparison of dg as calculated from ELPI and SMPS data. (C) Comparison of PMC2.5 between the ELPI and pDR. (D) Comparison of PSAC results, specifically comparing the ELPI PSAC estimate versus the NSAM LDSA.
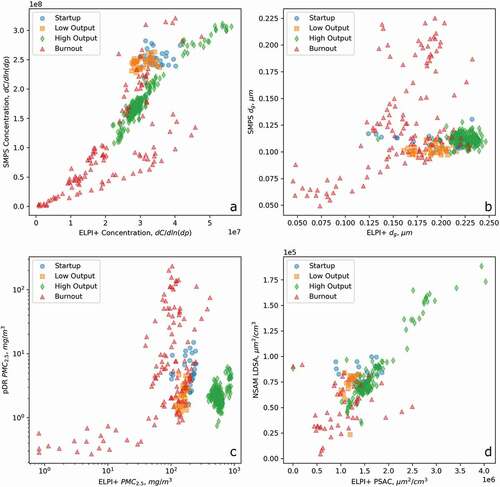
Figure 3. Timeseries plots of PNC measured during testing of chip boiler during two duplicate experiments with the four operating conditions using the ELPI. Red solid lines illustrate the first test run and the black dashed lines illustrate the second test run.
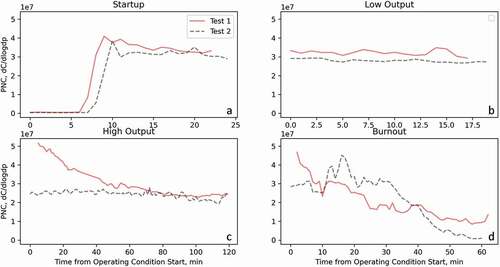
Figure 4. Scatterplot comparisons of data collected during testing of Appliance 2 over four different operating conditions: startup, low-output, high-output, and burnout. (A) PNC comparison between ELPI and SMPS. (B) Comparison of dg as calculated from ELPI and SMPS data. (C) Comparison of PMC2.5 between the ELPI and pDR. (D) Comparison of PSAC results, could not be performed due to a malfunction of the NSAM during this experiment.
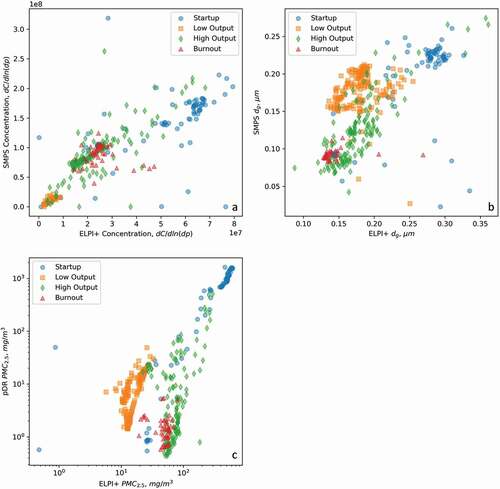
Figure 5. Scatterplot comparisons of data collected during testing of Appliance 3 over four different operating conditions: startup, low-output, high-output, and burnout. (A) PNC comparison between ELPI and SMPS. (B) Comparison of dg as calculated from ELPI and SMPS data. (C) Comparison of PMC2.5 between the ELPI and pDR. (D) Comparison of PSAC results, specifically comparing the ELPI PSAC estimate versus the NSAM LDSA.