
Figures & data
Figure 1. Time-series of PM emissions from a Step-2 2015 NSPS cordwood stove in a dilution tunnel, IDC fueling protocol (Stove #9, August 7, 2019).
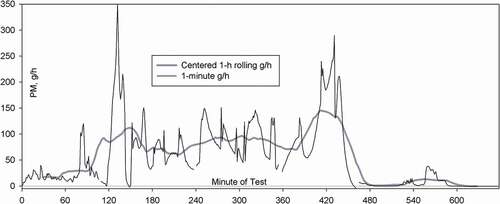
Table 1. 1405 TEOM 10-minute practical quantitation limit (PQL) at different sample flows, based on measurements made at 2 LPM sample flow.
Figure 2. Deming regression of collocated PM from a 1405D 2-channel TEOM, 10-minute block average data from a high emitting NSPS Step-2 cordwood stove.
Figure 3. Model 1400AB Teom vs. Manual Emfab Filter PM (mg/m3) in a dilution tunnel at BNL, desiccated equilibration times of 0-Day, 1-Day, and 1-Week. Dotted lines are 1:1.
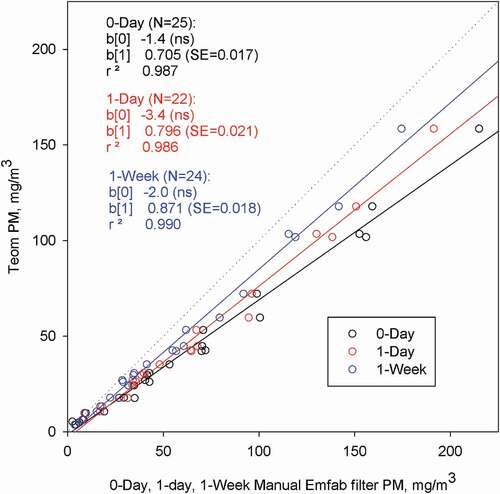
Figure 4. 1400AB Teom vs. Filter PM Concentration in a dilution tunnel, August 2016 – January 2017. Dotted line is 1:1.
Figure 5. TEOM model 1400 and 1405 vs. manual filter sample PM (mg/m3) for HLS cordwood tests.
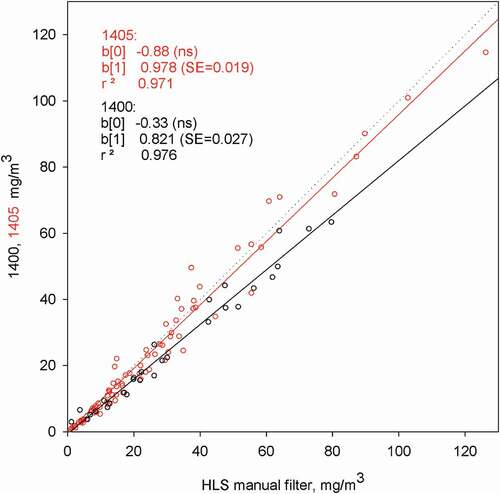
Figure 6. 1405 TEOM vs. manual filter sample PM (mg/m3) for pellet stove tests.
Figure 7. (a) 1405 TEOM vs. manual filter sample PM (mg/m3), same number of filters. (b) 1405 TEOM vs. manual filter sample PM (mg/m3), more TEOM than manual filters. Square symbols represent two samples removed from the analysis.
Table 2. Summary of regression parameters, TEOM (model indicated in parentheses) vs. equilibrated manual filter sample (intercepts are not significant).
Figure 8. PM from a cordwood boiler measured with TEOMs at 25 and 80°C.
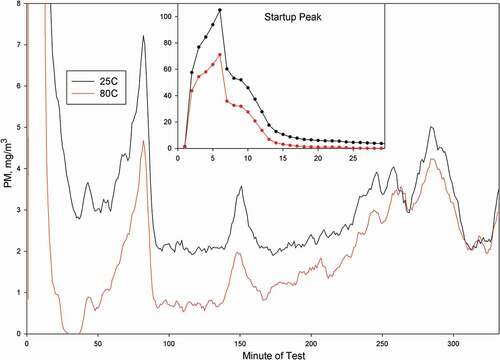
Table 3. Filter face velocities for different sampling methods.
Table 4. eBC to PM Ratio for twelve IDC runs on four different wood stoves.
Figure 9. Mass loss from the TEOM filter when sampling dry clean air.
Figure 10. TEOM filter mass loss for 52 hours after the end of a dilution tunnel test run.
Table 5. Test run average PM emission rate (g/h) with different numbers of filters used.
Data availability statement
The data that support the findings of this study are available from the corresponding author, [GA], upon reasonable request.