Figures & data
Table 1. Multi-phase testing protocol.
Figure 1. Graphical representation of appliance output and fuel load, fuel mass is shown as a red-dashed line, and appliance output is shown as a black-solid line.
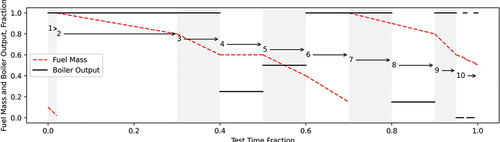
Figure 2. Schematic of combustion test setup featuring locations of instrumentation.
Table 2. Mean black carbon concentration, in units of micrograms per cubic meter (µg/m3), measured using the Magee Scientific Aethalometer Model 33, during each phase, of each test, for two wood-fired hydronic heating appliances.
Table 3. Mean brown carbon concentration, in units of micrograms per cubic meter (µg/m3), measured using the Magee Scientific Aethalometer Model 33, during each phase, of each test, for two wood-fired hydronic heating appliances.
Figure 3. Boxplot of minute-by-minute black carbon concentration measurements made using the Magee Scientific Aethalometer Model 33 during each phase for both appliances. Red with single hatch is hydronic heater A, blue with double hatch is hydronic heater B. The median is shown as an orange bar and the mean as a green triangle. The notches extend to 95% confidence interval around the median. Boxes extend to 25th and 75th percentile. Whiskers extend to the 5th and 95th percentiles. Outliers are suppressed.
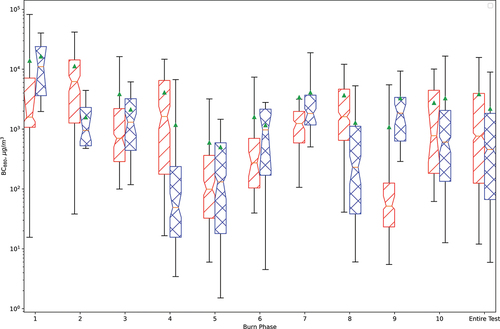
Figure 4. Boxplot of minute-by-minute brown carbon concentration measurements during each operating condition for both appliances. Red with single hatch is hydronic heater A, blue with double hatch is hydronic heater B. The median is shown as an orange bar and the mean as a green triangle. The notches extend to 95% confidence interval around the median. Boxes extend to 25th and 75th percentile. Whiskers extend to the 5th and 95th percentiles. Outliers are suppressed.
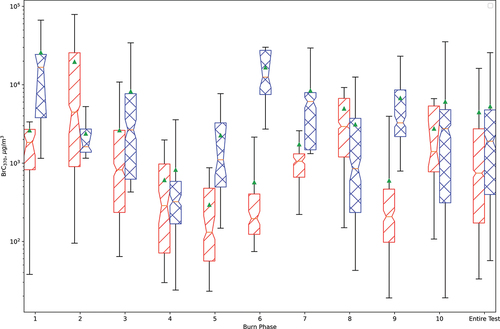
Table 4. Calculated angstrom absorption exponent for each appliance during each test phase for hydronic heater A (upper) and hydronic heater B (lower).
Figure 5. Boxplot of minute-by-minute AAE during each operating condition for both appliances. Red with single hatch is hydronic heater A, blue with double hatch is hydronic heater B. The median is shown as an orange bar and the mean as a green triangle. The notches extend to 95% confidence interval around the median. Boxes extend to 25th and 75th percentile. Whiskers extend to the 5th and 95th percentiles. Outliers are suppressed.
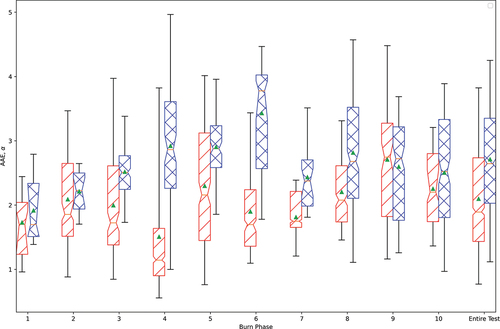
Table 5. Mean aerosol optical depth (units: inverse megameters, Mm−1) measurements made using the Thermo Scientific personal DataRam Model 1500 for each test, separated by phase, and appliance.
Figure 6. Boxplot of minute-by-minute aerosol optical depth measurements during each test section for both appliances. Red with single hatch is hydronic heater A, blue with double hatch is hydronic heater B. The median is shown as an orange bar and the mean as a green triangle. The notches extend to 95% confidence interval around the median. Boxes extend to 25th and 75th percentile. Whiskers extend to the 5th and 95th percentiles. Outliers are suppressed.
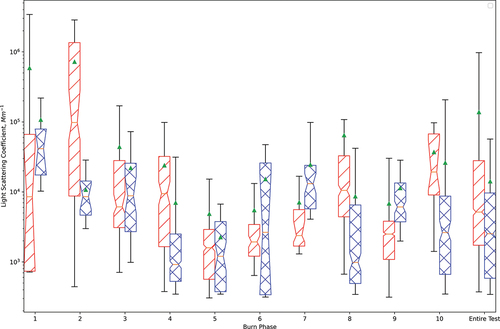
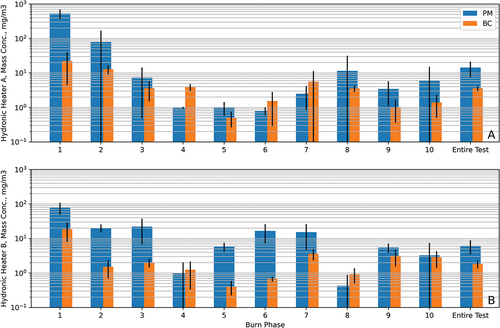
Figure 7. Bar chart comparison plots of gravimetric PM2.5 and AE33 BC measurements for two biomass hydronic heating appliances. Data from hydronic heater A is shown in the topmost chart (a), and data from hydronic heater B is shown in the bottommost chart (b).