Figures & data
Figure 1. Graph showing boiler output condition timeseries, fuel mass as red-dashed line, and boiler output as black-solid line.6.
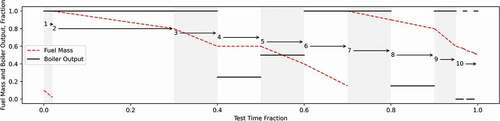
Table 1. Multi-phase testing protocol.
Figure 2. Schematic of combustion test set-up and location of various instrumentation.7.
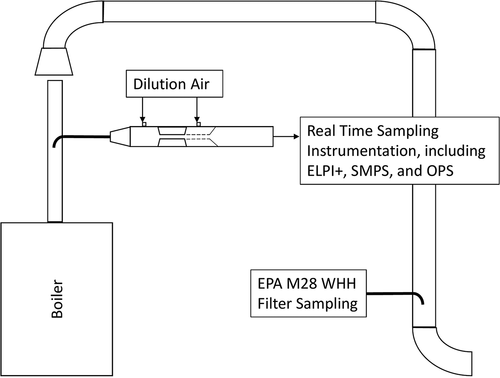
Figure 3. Boxplot showing minute-by-minute total particle concentration as measured by the Electrical Low Pressure Impactor +. Red single-hatch is Hydronic Heater A, blue cross-hatch is Hydronic Heater B. Medians are shown as an Orange bar and means are shown as a green triangle. Notches extend to 95% confidence interval around median. Boxes extend to 25th and 75th percentile. Whiskers extend to the 5th and 95th percentiles. Mean is shown as green triangle, and outliers are shown as open circles.12.
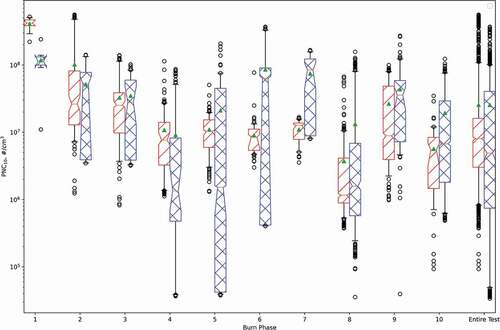
Table 2. Mean particle number concentration as measured using the Electrical Low-Pressure Impactor + instrument, in units of particle concentration per cubic centimeter (#/cm3), for each experimental test separated by appliance, test, and phase.
Table 3. Fraction of total particulate number concentration measured in each of the three size fractions for hydronic heater A & B by phase.
Table 4. Trimodal particle size distribution parameters for hydronic heater A and hydronic heater B during each phase averaged over the test series.
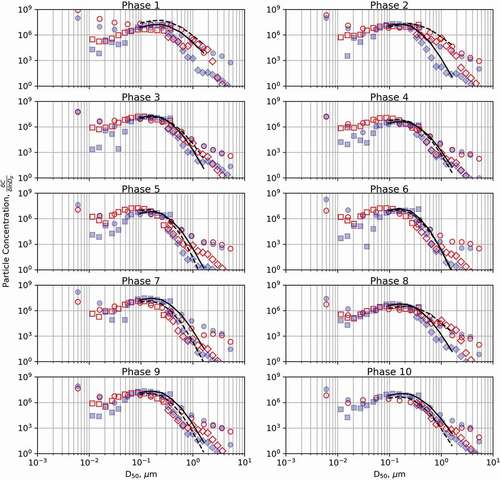
Figure 4. Particle size distribution plots for each hydronic heater and phase, x-axis is particle size in log-scale, y-axis is particle number concentration in log scale. Hydronic heater A data is shown as red hollow points and hydronic heater B data as blue filled points. The points show the mean particle number concentration of the Electrical Low Pressure Impactor+ stage (circle), TSI Scanning Mobility Particle Sizer bin (square), or TSI Optical Particle Sizer bin (diamond) at the D50 value.16.