Figures & data
Garvin A. Heath

Dwarakanath Ravikumar

Figure 1. Electricity generation by technology in 2020, 2035, and 2050 as simulated in the Solar Futures Study (reproduced with permission (DOE Citation2021)). Ref. = reference scenario; Decarb = decarbonization of the electric sector scenario; Decarb + E = electric sector decarbonization plus electrification of other parts of the economy; Bio = biomass, Geo = geothermal, Hydro = hydropower (including pumped hydro-storage), CT = combustion turbine, CSP = concentrating solar power. See SI Section S2.1 for further explanation).
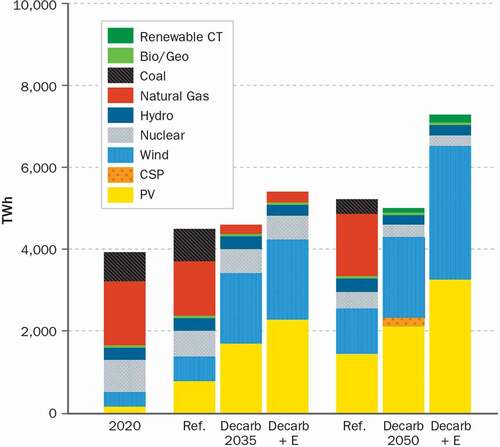
Figure 2. Time series illustrating historical and forecasted global prices (dotted line, left vertical axis) and cumulative demand (shaded area, right vertical axis) for LIBs in stationary and transportation (EV) markets from 2010 to 2035. (BloombergNEF Citation2021). According to BloombergNEF, in the past decade the unit price for LIBs has dropped to less than 12% of what it was in 2010 and is expected to further decrease to about 4% of the 2010 price by 2035. As the price continues to decrease, LIB demand is projected to increase 44,000-fold from 2010 to 2035.
Figure 3. Projected annual global material demand for PV manufacturing in 2030 and 2050 relative to 2018 global supply, data extracted from (Carrara et al. Citation2020). Results for the low and medium scenarios from the International Energy Agency and the high scenario from the Institute for Sustainable Futures of the University of Technology Sydney are shown, where medium is the baseline scenario (see SI Section S2.1 for more information). Note that Te, Si, and Glass use the y-axis on the left side, whereas all others refer to the y-axis scale on the right side. The levels of projected demand for c-Si module bulk materials, Si and Ag, are below 2018 global supply. The projected Cd demand for CdTe modules also remains under 2018 availability. In contrast, the projected demand for Te in 2030 is over 4 times, and in 2050 over 6 times the 2018 supply.
Figure 4. Comparison of projected global demand and current supply for cobalt by sector (duplicated with permission from Campagnol et al. Citation2018). Demand for cobalt from the battery industry is forecasted to dominate cobalt demand by 2025. Furthermore, demand from all sectors by 2025 is projected to be 201 kt, more than double the supply available in 2018 (~95 kt). Demand versus supply projections like this have motivated research into how to recover metals from end-of-life technologies to dampen demand for virgin materials. (p.a. = per annum).
Table 1. R strategy description with examples from a manufacturer’s and consumer’s (for R0–R2) perspective (adapted from Potting et al. Citation2017 and supplemented by Morseletto Citation2020; Reike, Vermeulen, and Witjes Citation2018)
Table 2. Inclusion criteria for each screen of the systematic literature review
Figure 5. Global market projections of LIBs in the transportation and stationary energy storage markets categorized by cathode chemistry (IEA Citation2021c; Wood Mackenzie Citation2021). The largest fraction of demand is for NMC, driven by the transportation market, with projected 2040 demand being more than double the second highest chemistry, LFP. Furthermore, the demand for LIBs by the transportation sector in 2040 dwarfs the demand for stationary LIBs. The category “other” includes LMO and other chemistries that are still in early research and development phases. Sources: IEA (Citation2021), [The Role of Critical Minerals in Clean Energy Transitions], All rights reserved. Wood Mackenzie (Citation2021), [Battery Raw Materials Service – 2021 update to 2040: Demand – H1 2021].
![Figure 5. Global market projections of LIBs in the transportation and stationary energy storage markets categorized by cathode chemistry (IEA Citation2021c; Wood Mackenzie Citation2021). The largest fraction of demand is for NMC, driven by the transportation market, with projected 2040 demand being more than double the second highest chemistry, LFP. Furthermore, the demand for LIBs by the transportation sector in 2040 dwarfs the demand for stationary LIBs. The category “other” includes LMO and other chemistries that are still in early research and development phases. Sources: IEA (Citation2021), [The Role of Critical Minerals in Clean Energy Transitions], All rights reserved. Wood Mackenzie (Citation2021), [Battery Raw Materials Service – 2021 update to 2040: Demand – H1 2021].](/cms/asset/7e0e1e30-9a1b-4e6d-9be0-73c0e688ef0a/uawm_a_2068878_f0005_c.jpg)
Figure 6. Projection of global PV capacity (GWp) and market share (%) for c-Si and thin-film technologies, data extracted from (SPV Market Research, 2021) (Mints Citation2018). CdTe makes up the largest segment of thin-film technologies, with the U.S. CdTe manufacturer First Solar alone manufacturing 6 GW, or 3% of the PV market in 2020 (Miller, Peters, and Zaveri Citation2020). Together, c-Si and CdTe represent almost 100% of the annual capacity additions today through 2025. (Note: Results from SPV’s “conservative” scenario are shown).
Figure 7. Process by which the systematic literature review was performed, following Preferred Reporting Items for Systematic Reviews and Meta-Analyses (PRISMA) guidelines. Specific steps used certain database and computer programs (see color-coded legend). The total number of publications obtained from the searches is represented by n = universe. The number of publications included in each screening process is represented by nin_x, where x represents the screen iteration (see left side labels). The number of publications excluded by each step is represented by nex_x. The values of nin_x for each screen per technology can be seen in . The criteria for inclusion at each step can be found in
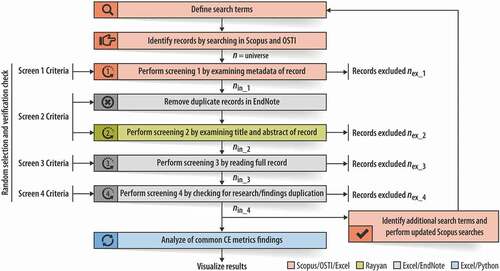
Figure 8. Number of publications of the universe and those that passed each screen for LIBs and PV. “Universe” refers to all publications identified based on the search terms used in SCOPUS and OSTI cumulatively from all search rounds, and equals 1,354 for LIBs and 1,757 for PV.
Table 3. Classifiers and sub-classifiers of LIB and PV publications
Figure 9. A systems diagram representing the CE strategies for the manufacturing (M), installation and use (U), and the collection and recycling (EOL) phases of the life cycle of LIB systems, which are depicted as black circles. Physical material flows, shown on the right side of the black circles with black lines, are the CE pathways traditionally depicted in systems diagrams; we have added digital platforms and information system (Info Sys) pathways in blue which can enable or enhance the material ones. Because a transition to renewable energy is a goal of the CE, we mark the life cycle phases that could incorporate renewable energy with Orange circles. The stakeholders include various actors who participate in and contribute towards the CE of LIB. The decision enablers include the different policies that incentivize the CE, and analytical tools, which help quantify the economic and environmental impacts of the CE. Allied industries manufacture non-LIB products which can either utilize secondary materials recovered from a CE for LIBs or supply secondary materials to be utilized in the manufacture of LIBs. (EV: Electric Vehicle, S: Stationary, PSS: product-service system, SOH: State of Health).
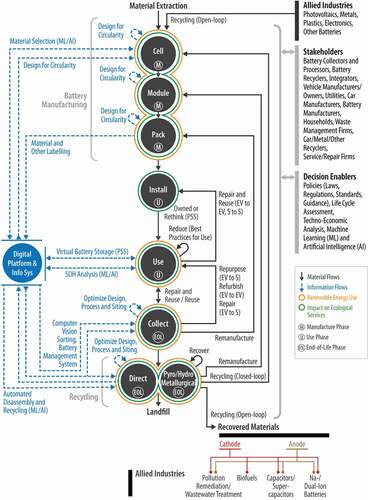
Figure 10. A distillation of pre-processing and metallurgical operations of selected commercial LIB (left) and PV (right) recyclers. Pre-processing (in Orange) and metallurgical (in green) operations are listed in the center. These operations typically occur sequentially from top down, however some recyclers perform them in different orders or can skip certain operations based on their specific process and target materials. A circle within a cell in a row indicates the operation corresponding to the row is used by the LIB or PV recycler. A blank cell in a row indicates the operation is not used by that recycler. (Umi = Umicore (Samarukha Citation2020; Velázquez et al. Citation2019), Akk = Akuuser (Pudas, Erkkila, and Viljamaa Citation2011; Akuuser Citation2021; Harper et al. Citation2019; Samarukha Citation2020; Velázquez et al. Citation2019), Due = Duesenfeld (Duesenfeld Citation2021; Hanisch Citation2019; Harper et al. Citation2019; Samarukha Citation2020; Velázquez et al. Citation2019), Rec = Recupyl (Harper et al. Citation2019; Meshram, Pandey, and Mankhand Citation2014; Recupyl Citation2013; Samarukha Citation2020; Velázquez et al. Citation2019), Ret = Retriev (Harper et al. Citation2019; Novis Smith and Swoffer Citation2013; Retriev Technologies Citation2021; Samarukha Citation2020; Velázquez et al. Citation2019), Ont = OnTo Technologies (BEST Magazine Citation2020; Samarukha Citation2020; Sloop et al. Citation2020; Velázquez et al. Citation2019), Sum = Sumitomo-Sony (Cardarelli and Dube Citation2007; Samarukha Citation2020; Velázquez et al. Citation2019), Acc = Accurec (Gratz et al. Citation2014; Samarukha Citation2020; Velázquez et al. Citation2019), Lit = Lithorec (Samarukha Citation2020), Bat = Battery Resourcers (Gratz et al. Citation2014; Samarukha Citation2020; Velázquez et al. Citation2019), Fre = FRELP/Sasil (Latunussa et al. Citation2016), Veo = Veolia (Veolia Citation2021a), Fir = First Solar (Sinha, Cossette, and Ménard Citation2012), Sol = SolarRecyclingExperts (SolarRecyclingExperts Citation2021)).
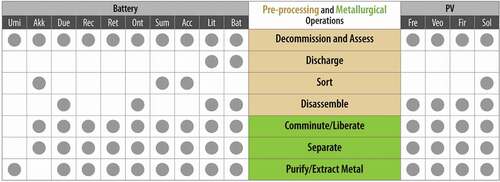
Figure 11. Prevalence (counts) of LIB CE strategies reported in original research publications (columns in top panel) along with corresponding prevalence (percentage) by cathode chemistry in each CE strategy (pie charts in bottom panel). “Exclusive” indicates that the publication reports only one sub-classifier or can be classified as only one study type, “Multiple” indicates that the publication reports multiple sub-classifiers or can be classified as multiple study types. (n = 332; note that for the pie charts, a given publication may report multiple chemistries. The total number of publications of the pie charts for the different CE strategies from Refuse (R0) to Recover (R9) are 1, 10, 2, 16, 4, 7, 69, 66, 232, and 2).
Figure 12. Annual count of the different LIB CE strategies which were reported in original research publications from 2000 to 2021. (n = 332). Note that publications that analyze multiple CE strategies were counted under each. Year of publication reflects a journal’s planned official publication date, even if made available on-line earlier. Thus, there were some publications released in December 2021, with official publication dates in 2022.
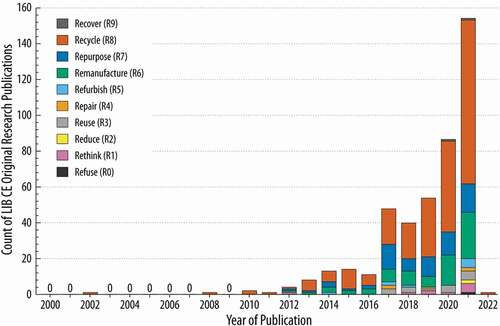
Figure 13. Counts of LIB CE publications based on the classifiers listed in : of Indicators (A), Life Cycle Phase (B), Scope of CE Strategy (C), Scale of Operations (D) or based on the study type (where E includes all publications and F just reviews). (See for explanation of “Exclusive” and “Multiple”. Count of analyzed publications in panels A–D is 332 original research publications, panel E is 444 total publications, and panel F is 112 review publications, all of which passed the four screens. Since reviews were further classified in (F), they were considered their own study type in (E) and categorized exclusively as reviews). (Life. Ext. = lifetime extension; Raw Mat. Ext. = raw material extraction; Tech. Dev. = technology development; Perf. = performance; LCA = life cycle assessment; TEA = technoeconomic analysis).
Figure 14. Counts of LIB CE original research publications based on the Cathode Chemistry (A) and Application (B). Frame (B) displays both the publication counts (left column chart) and proportion of publications from each chemistry (right side pie charts). (See for explanation of “Exclusive” and “Multiple”; n = 332.).
Figure 15. Counts of original research publications which applied CE strategies for different LIB Cell Components (A) and LIB Components (B). Explanations of “Exclusive”, “Multiple”, and “Not reported” can be found in . Both graphs represent 332 original research publications, all of which passed the 4 screens.
Figure 16. A systems diagram representing the CE strategies for the manufacture (M), install and use (U), and the collect and recycle (EOL) phases of the life cycle of PV. For an explanation of the different CE strategies, the stakeholders, information and material flows and the legend used please refer to .
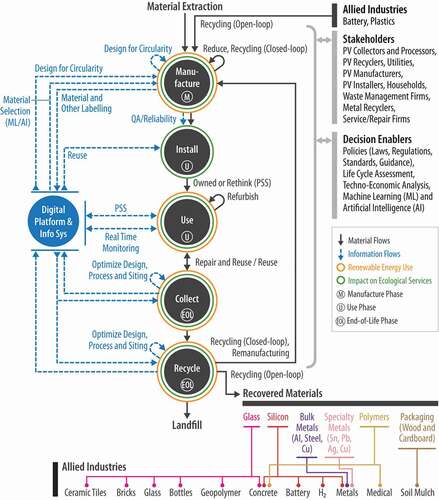
Figure 17. Prevalence (counts) of CE strategies reported in original research publications (columns) along with corresponding prevalence (percentage) for PV technology in each CE strategy (pies). (See for explanation of “Exclusive” and “Multiple”. (n = 160). Note that for the pie charts, a given publication may report multiple technologies).
Figure 18. Annual count of the different CE strategies for PV systems which were reported in original research publications from 2000 to 2021. (n = 160. Note that publications that analyze multiple CE strategies were counted under each. The counts account for c-Si and CdTe, as well as publications that did not report which technology they studied. Year of publication reflects a journal’s planned official publication date, even if made available on-line earlier).
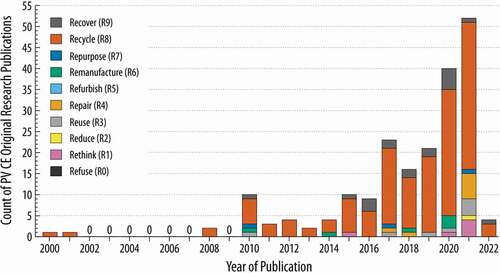
Figure 19. Materials recovered from recycling (A) c-Si PV modules (n = 69 publications), and (C) CdTe modules (n = 30) based on counts of publications reporting original research; and annual count of original research publications by the materials recovered from recycling of (B) c-Si PV modules and (D) CdTe PV modules. Note that the encapsulant is typically EVA, and “Al/Cu” refers to aluminum and copper inside of the module. (11 c-Si and 23 CdTe publications which studied recycling did not report the recovery of any material and thus were excluded from the graphs. See for explanation of “Exclusive” and “Multiple”).
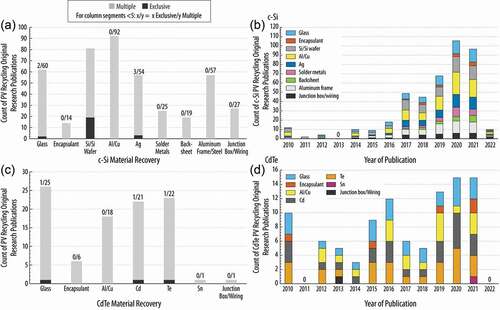
Figure 20. Counts of PV CE publications based on the classifiers listed in : of Indicators (A), Life Cycle Phase (B), Scope of CE Strategy (C), Scale of Operations (D) or Study Type (where E includes all publications and F just reviews). (See for explanation of “Exclusive” and “Multiple”, and for explanation of abbreviations and acronyms. Count of analyzed publications in panels A–D is 160 original research publications, panel E is 181 total publications, and panel F is 21 review publications, all of which passed the four screens. Since reviews were further classified in (F), they were considered their own study type in (E) and categorized exclusively as reviews. Some publications were not able to be classified when they did not report that aspect. For each panel, publications not reporting, and thus excluded from the count displayed, are: (A) = 71; (D) = 8); with all of the other panels = 0 publications not reporting. Note that since a given publication could have analyzed both PV technologies, that publication will count towards both in the pie charts of panel D).