
Figures & data
Figure 1. Camx nested 12 km and 36 km model domains, and the 13 WRAP states that were evaluated in the low-level source apportionment. Other source regions include the non-WRAP states, Canada, Mexico, and U.S. And non-U.S. commercial marine vehicles.
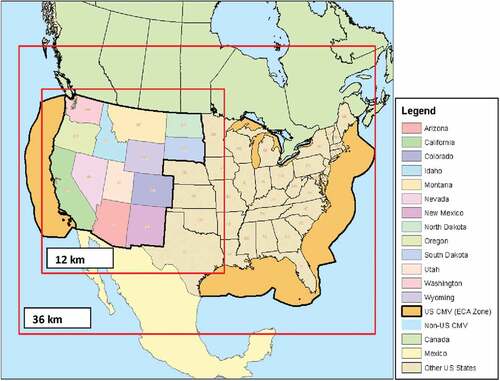
Figure 2. (a) Total 2028 anthropogenic SO2 emissions from the 13 contiguous WRAP region states, and (b) individual WRAP region state contributions.
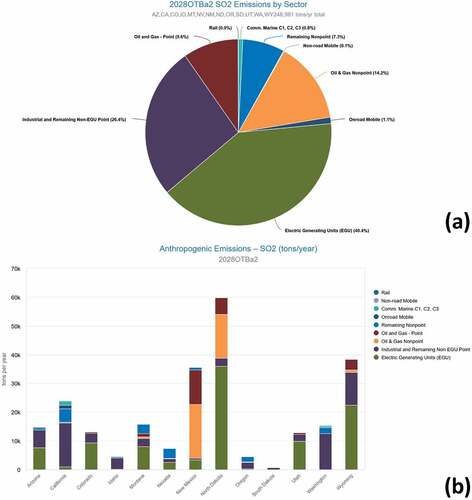
Figure 3. (a) Total 2028 anthropogenic NOx emissions from the 13 contiguous WRAP region states, and (b) individual WRAP region state contributions.
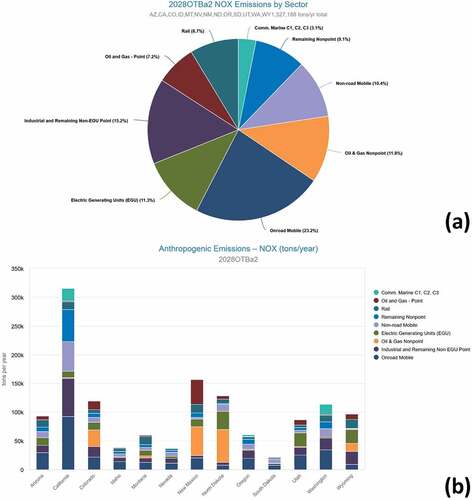
Figure 4. Class 1 areas within the CAMx 12 km model domain, and the eight example sites of Olympic National Park (‘OLYM’), Yellowstone National Park (‘YELL’), Lostwood National Wildlife Refuge (‘LOST’), Rocky Mountain National Park (‘ROMO’), Salt Creek Wilderness Area (‘SACR’), Jarbidge Wilderness Area (‘JARB’), Grand Canyon National Park (‘GRCA’), and San Rafael Wilderness Area (‘RAFA’).
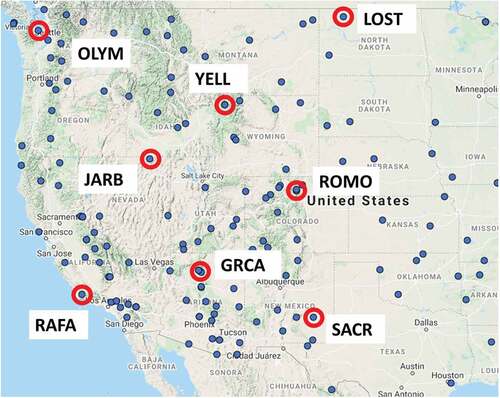
Figure 5. Olympic National Park (‘OLYM’; Washington) high-level source apportionment results (a) and low-level source apportionment results for (b) AmmSO4 and (c) AmmNO3 from anthropogenic sources.
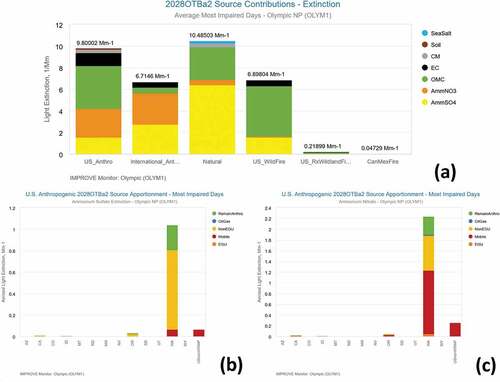
Figure 6. Yellowstone National Park (‘YELL’; Wyoming) high-level source apportionment results (a) and low-level source apportionment results for (b) AmmSO4 and (c) AmmNO3 from anthropogenic sources.
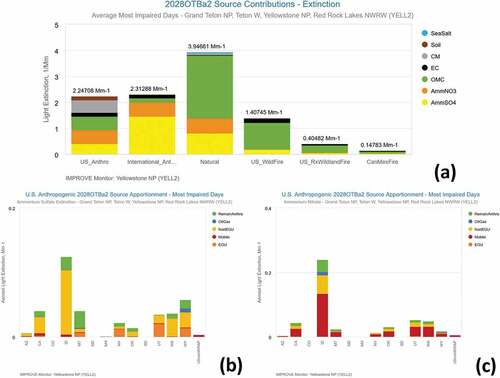
Figure 7. Lostwood National Wildlife Refuge (‘LOST’; North Dakota) high-level source apportionment results (a) and low-level source apportionment results for (b) AmmSO4 and (c) AmmNO3 from anthropogenic sources.
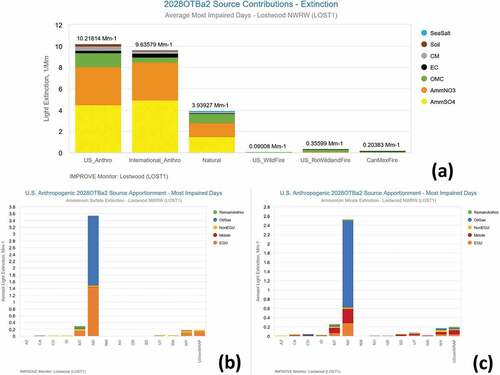
Figure 8. Rocky Mountain National Park (‘ROMO’; Colorado) high-level source apportionment results (a) and low-level source apportionment results for (b) AmmSO4 and (c) AmmNO3 from anthropogenic sources.
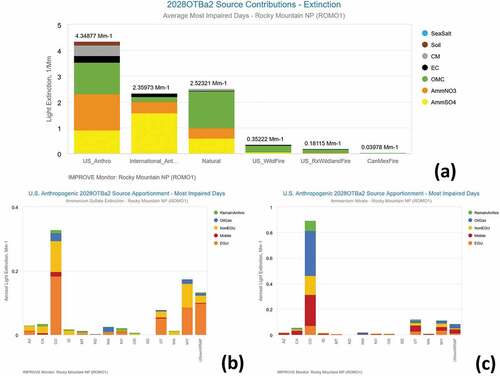
Figure 9. Salt Creek Wilderness Area (‘SACR’; New Mexico) high-level source apportionment results (a) and low-level source apportionment results for (b) AmmSO4 and (c) AmmNO3 from anthropogenic sources.
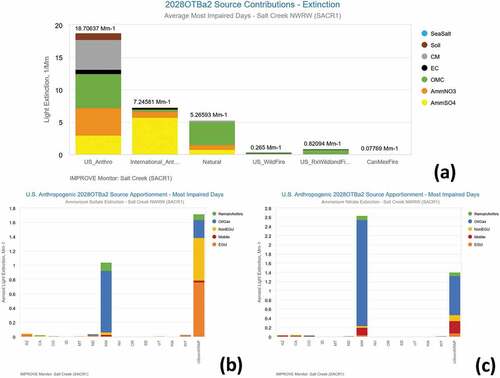
Figure 10. Jarbidge Wilderness Area (‘JABR’; Nevada) high-level source apportionment results (a) and low-level source apportionment results for (b) AmmSO4 and (c) AmmNO3 from anthropogenic sources.
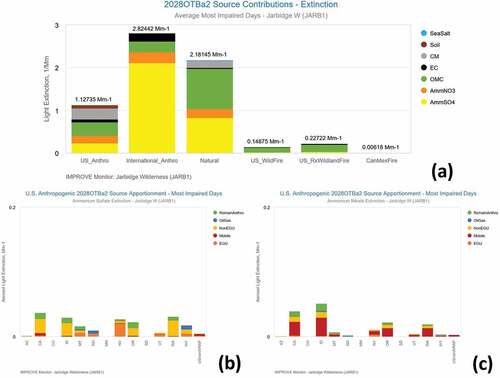
Figure 11. Grand Canyon National Park (‘GRCA’; Arizona) high-level source apportionment results (a) and low-level source apportionment results for (b) AmmSO4 and (c) AmmNO3 from anthropogenic sources.
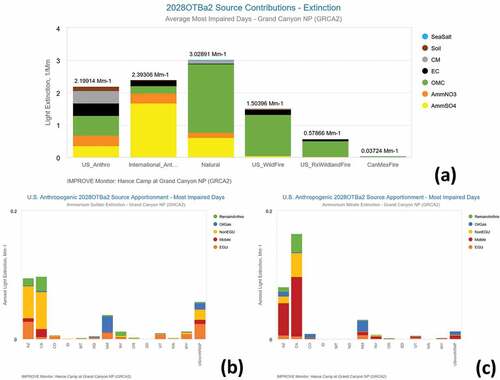
Figure 12. San Rafael Wilderness Area (‘RAFA’; California) high-level source apportionment results (a) and low-level source apportionment results for (b) AmmSO4 and (c) AmmNO3 from anthropogenic sources.
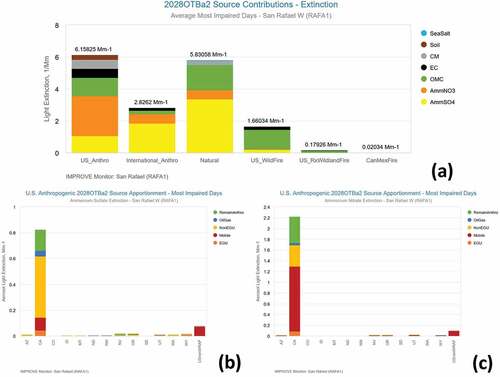
Table 1. Estimated SO2 and NOx emissions (ton/yr) from oil and gas activity for North Dakota, New Mexico, and Colorado from the representative baseline (2014–2018, ‘RepBase2’) and future (2028, ‘2028otba2’) inventories.
Figure 13. Example high level source apportionment results using (a) the 20% Most Impaired Days (‘MID’) and (b) the 20% Modeled Most Impaired Days (‘ModMID’) at San Rafael Wilderness Area (‘RAFA’).
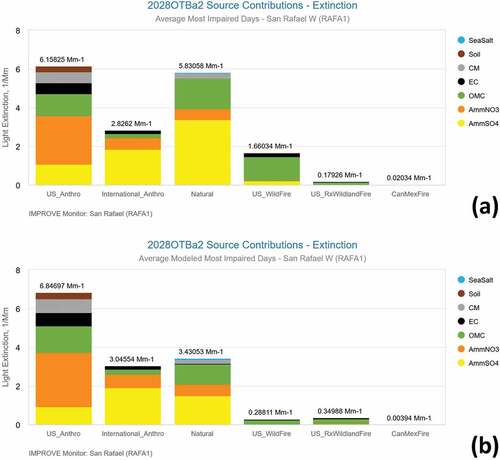
Table 2. Summary of the high-level source apportionment results by emission categories for the eight example CIAs.
Data availability statement
The data that support the findings of this study are openly available at the Western Regional Air Partnership’s Technical Support System (WRAP TSS):
http://views.cira.colostate.edu/tssv2/Express/ModelingTools.aspx
http://views.cira.colostate.edu/tssv2/Express/EmissionsTools.aspx