
Figures & data
Figure 1. Comparison of plant extracts used for nanoparticles synthesis (source: Saif et al., Citation2016).
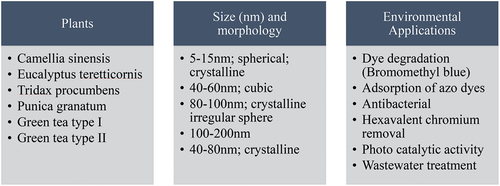
Figure 2. Procedure for preparation of FeNPs.
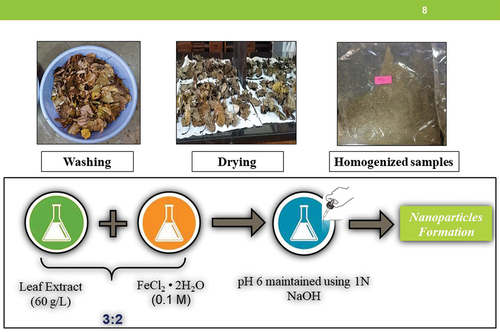
Figure 3. Chemical structure of dye (a) eosin yellow (b) fuchsin basic.
Figure 4. Percentage composition of leaf litter in the university nursery, Delhi.
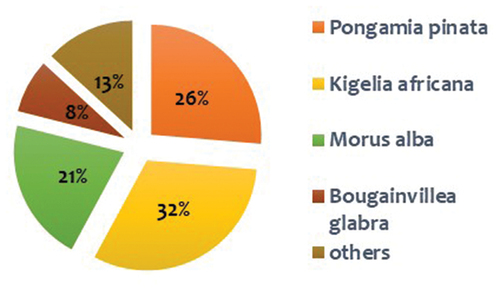
Figure 5. Percentage composition of leaf litter in the university ridge, Delhi.
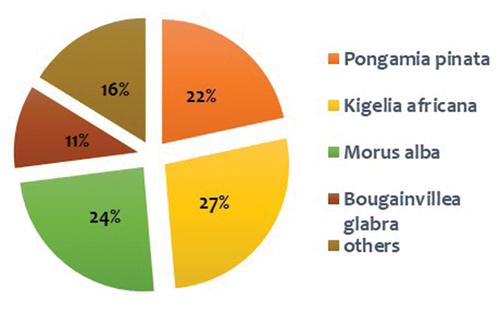
Table 1. Final yield of nanoparticles from different plant samples.
Figure 6. FTIR of Pongamia Pinnata.
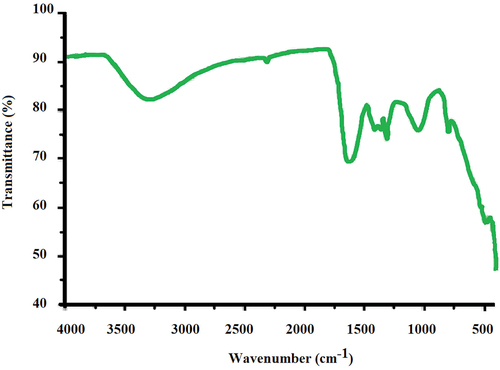
Figure 7. SEM images of (a) Pongamia pinnata; (b) Kigelia africana ; (c) Morus alba; (d) Prosopis juliflora.
Figure 8. EDX of Pongamia pinnata.
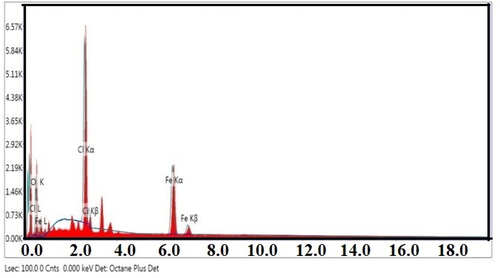
Figure 9. XRD images of (a) Pongamia pinnata, (b) Kigelia africana.
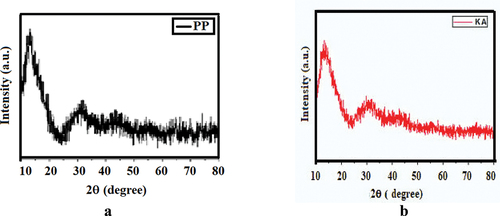
Figure 10. TEM images and histogram: (a) Pongamia pinnata, (b) Kigelia africana.
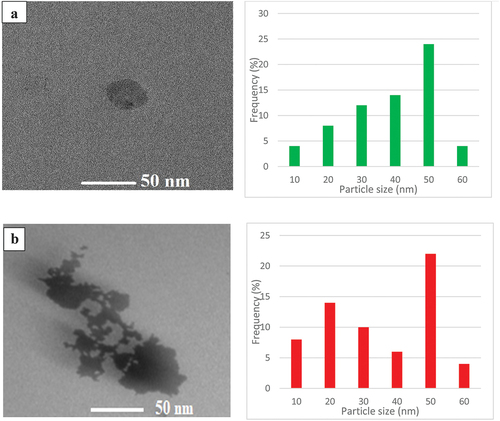
Figure 11. Time dependent efficiency of FeNPs to degrade fuchsin basic and eosin yellow.
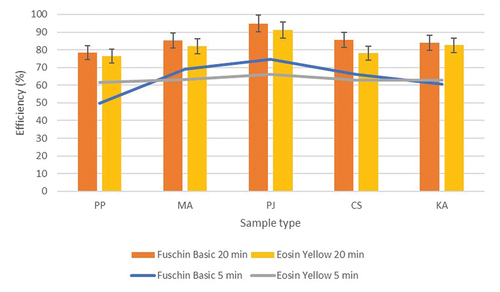
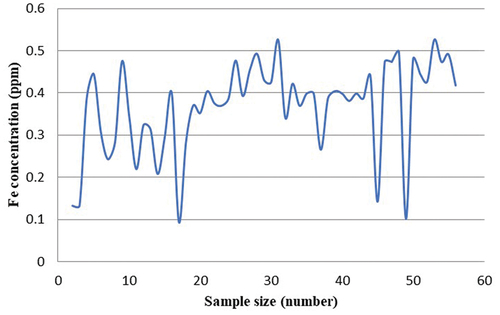
Figure 12. Iron concentration in degraded dye samples.
Data availability statement
The authors confirm that the data supporting the findings of this study are available within the article and its supplementary materials.