Figures & data
Figure 1. Anthropogenic sources of ammonia in the U.S. in 2020 from the U.S. EPA. Anthropogenic emissions total 4.97 million tonnes (Citation2023a; https://www.epa.gov/air-emissions-inventories/2020-nei-supporting-data-and-summaries, accessed June 5, 2023).
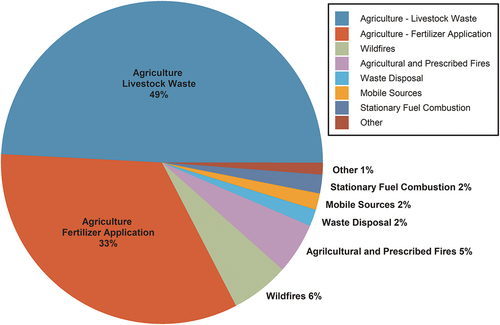
Figure 2. Time series of annual total anthropogenic emissions of reduced nitrogen (NH3) (a) and oxidized nitrogen (NOx) (b) for the U.S. (from U.S. EPA Citation2023b).
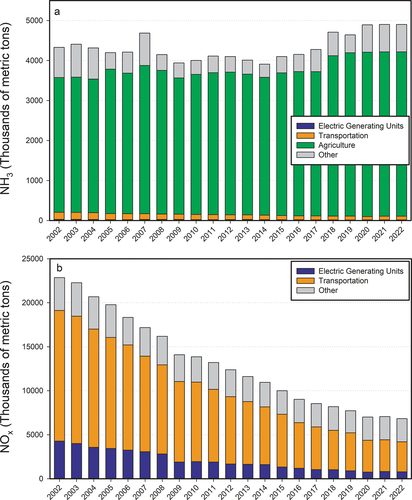
Figure 3. Time series of area weighted mean annual total nitrogen and oxidized (NOy) and reduced nitrogen (NHx) deposition (a) and the fractional contributions of components of wet and dry N deposition to total N deposition (b) for the conterminous U.S. Data are from the National Atmospheric Deposition Program Total Deposition (TDep) committee.
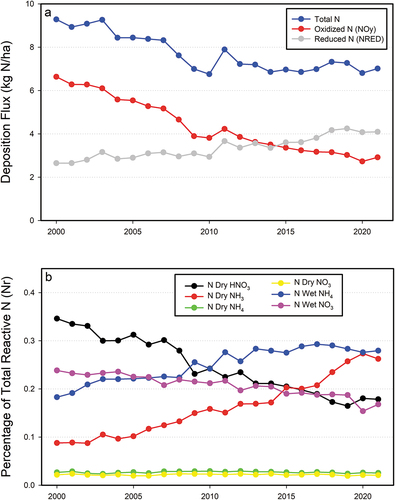
Figure 4. Conceptual diagram of the nitrogen cycle, with a focus on transformations, fate, and effects of ammonia (NH3) and ammonium (NH4+). The conceptual model depicts the Sections of the manuscript: human health and visibility (2.1), climate forcings (2.2), ecosystem impacts (2.4); atmospheric emissions, transport, and fate (3.0); and ammonia management (4.0).
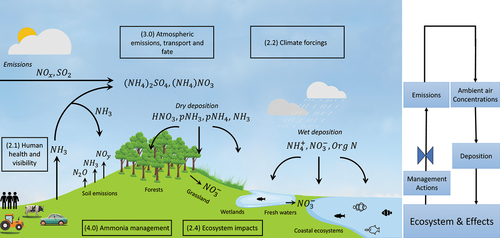
Figure 5. Light extinction composition at Class I areas for the upper 20th percentile of most impaired days. The size of each pie chart represents the light extinction coefficient in Mm−1 scaled to the largest value, which is 62 Mm−1 at Mammoth Cave, KY (Source: TSS Light Extinction Composition Pie Map – Product #XATP_ECPM_PCBP, WRAP Technical Support System (TSS); CSU and the Cooperative Institute for Research in the Atmosphere (CIRA), available at https://views.cira.colostate.edu/tssv2/Express/AmbientDataAnalysisTools.aspx, accessed 14 Aug 2023).
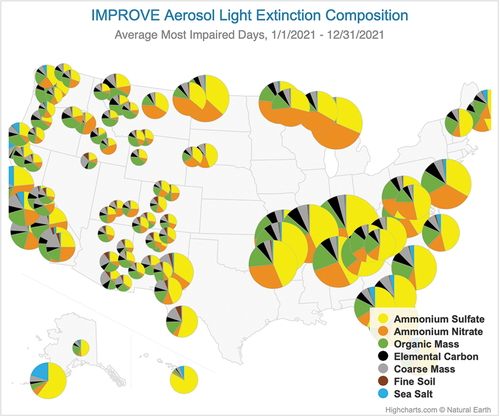
Figure 6. Maps of total oxidized nitrogen deposition (NOy)(a) and total reduced nitrogen (NHx) deposition (b) (as kg N ha−1 yr−1) for the conterminous U.S. for 2000–2002 and 2019–2021. Data are from the National Atmospheric Deposition Program Total Deposition (TDep) committee.
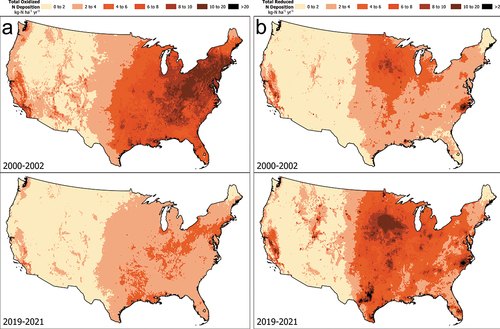
Figure 7. Maps comparing the percent of total nitrogen deposition occurring as total reduced nitrogen (NHx) for the conterminous U.S. for 2000–2002 (a) with 2019–2021 (b). Data are from the National Atmospheric Deposition Program Total Deposition (TDep) committee.
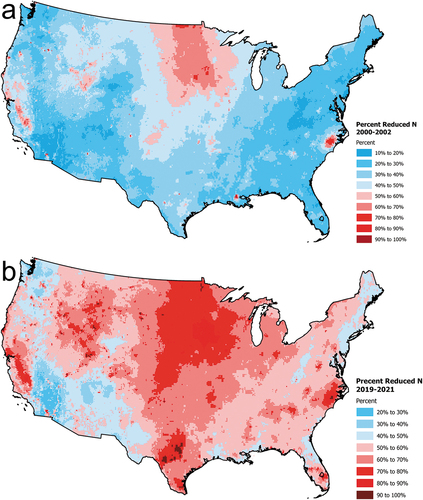
Figure 8. Conceptual diagram showing the pathways of nitrogen fate and transport in terrestrial ecosystems (modified after Lovett and Goodale Citation2011).
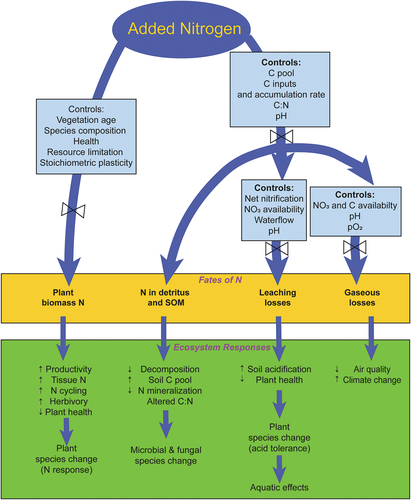
Figure 9. Conceptual diagram showing the microbial dissimilatory processing of nitrogen in the environment. DNRA is dissimilatory reduction to ammonium. Annamox is ammonium reduction to molecular nitrogen. Shading indicates are processes occurring in oxidizing and reducing environments. Note: pH sensitive N processes are indicated by control valves.
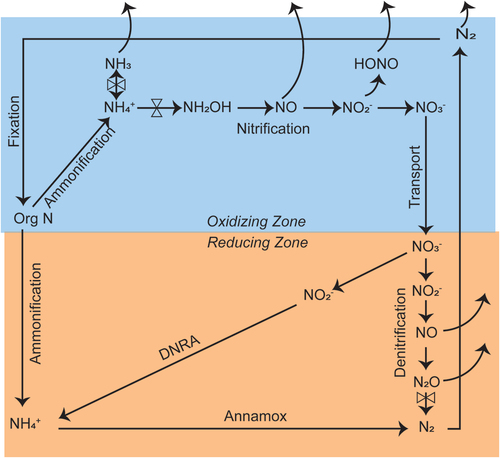
Figure 10. Maps of nitrogen critical load exceedances for the conterminous U.S. for species richness of lichens (a); species richness of herbaceous plants (b); a 5% decrease in tree growth (c); and tree survival (d). Shown are in blue- no exceedance; yellow- exceedance that could be eliminated by oxidized nitrogen; brown- exceedance that could be eliminated by reduced nitrogen; and red- a combination of oxidized and reduced nitrogen is necessary to eliminate the exceedance. A description of the datasets and methods used to determine exceedances of nitrogen critical loads are provided in the Supporting Information.
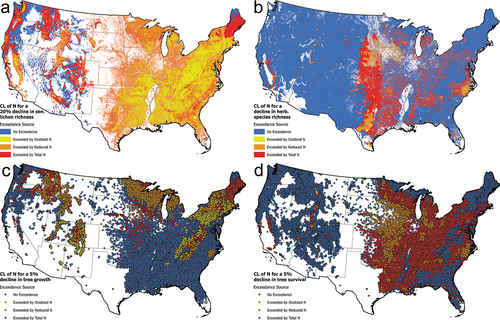
Table 1. Summary of total land area in the conterminous U.S. of vegetation resources and estimates of the land areas of exceedances of critical loads of total nitrogen, including areas where exceedances can be avoided by decreases solely of either reduced (NHx) or oxidized (NOy) N deposition.
Figure 11. Map of nitrogen critical load exceedances for lakes in the conterminous U.S. Shown are in blue- no exceedance; yellow- exceedance that could be eliminated by oxidized nitrogen; brown- exceedance that could be eliminated by reduced nitrogen; and red- a combination of oxidized and reduced nitrogen is necessary to eliminate the exceedance. A description of the datasets and methods used to determine exceedances of nitrogen critical loads are provided in the Supporting Information.
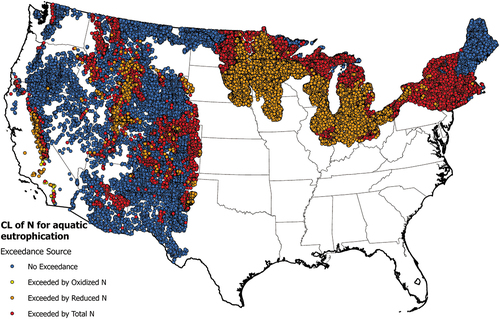
Figure 12. Mean North American agriculture ammonia (a) emissions used by GEM-MACH, (b) mean surface NH3 concentrations for July and August 2016, modeled by GEM-MACH, and (c) corresponding CrIS NH3 surface concentrations. From Shephard et al. (Citation2020).
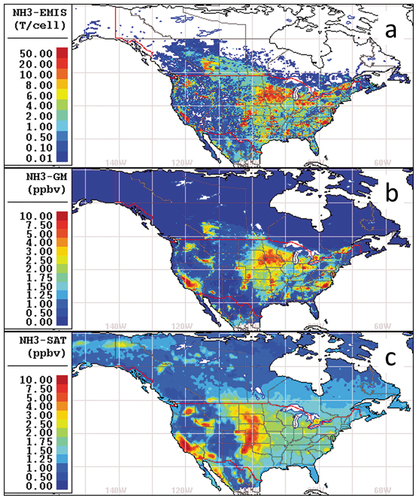
Figure 13. CrIS surface NH3 data from the May–October period oversampled onto a 0.002° grid for 2019 (a) and number of dairies per square kilometer (b). Surface NH3 concentrations from measurements at several locations throughout the valley are overlaid in (a). From Cady-Pereira et al. (Citation2024).
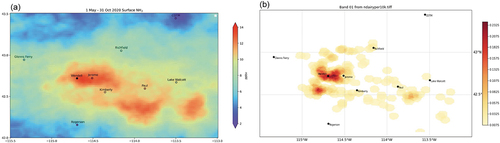
Figure 14. Air column ammonia profiles compared to aircraft data obtained during DISCOVER-AQ California campaign in the winter of 2013. Left (blue): direct comparison. Right (red): comparison with satellite observation operator (H) applied to aircraft data. Adapted from Cady-Pereira et al. (Citation2024).
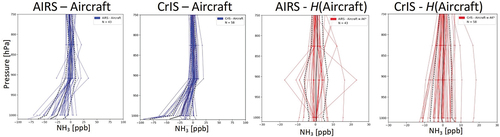
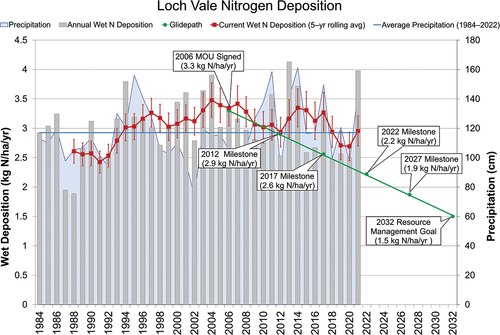
Figure 15. Wet deposition of nitrogen and precipitation quantity at the Loch Vale monitoring site in Rocky Mountain National Park, Colorado compared to the 2032 resource management target of 1.5 kg N ha−1 yr−1. Source: (Morris Citation2024).