
Figures & data
Table 1. Surrogate Organic species profiles
Figure 1. The flow temperatures and velocities calculated with NPSS are compared for the CFM56 and the V2527 across a range of power conditions (100, 85, 65, 30, 7, and 4% rated thrust). While the trends are similar for both engines, the distinct values are different, especially for the core, due to the differing designs of these two engines.
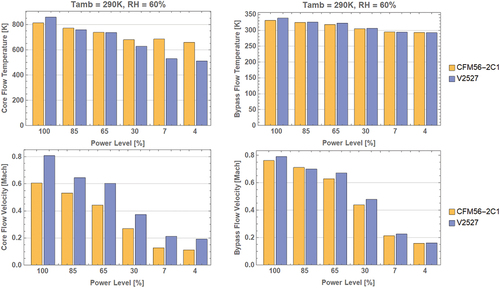
Figure 2. The time histories, plotted versus downstream distance, of the condensed species in the droplet mode is tracked versus downstream distance. The total HC concentration is 400 ppbv and the Nom/Nom profile cases are shown for 4 sulfur levels. The 5 ppmm FSC level did not form droplets, so no curves are present in the figure for this case.
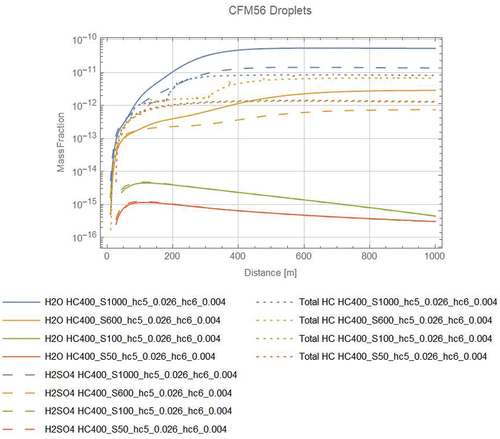
Figure 3. The lower panel (3b) shows the formation and growth of embryos, which form the nuclei which also grow to become the droplets shown in the upper panel (3a). These are for the case 400 ppbv HC with a Nom/Nom profile and 100 ppmm FSC for the V2527 engine.
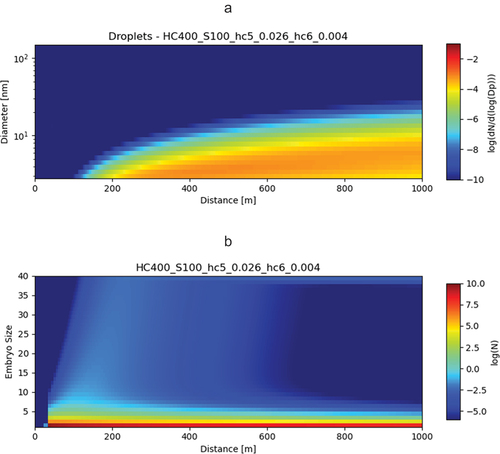
Figure 4. As , the lower panel (4b) shows the formation and growth of embryos, which form the nuclei which also grow to become the droplets shown in the upper panel (4a). These are for the case 400 ppbv HC with a Nom/Nom profile and 1000 ppmm FSC for the V2527 engine.
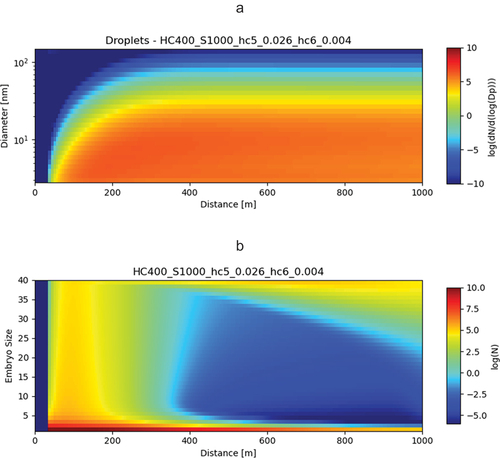
Figure 5. The EInum for the droplet mode is plotted versus downstream distance for the V2527 engine for the HC 400 ppbv, Nom/Nom profile case with a range of FSCs: Panel a) 100, Panel b) 600, and Panel c) 1000 ppmm
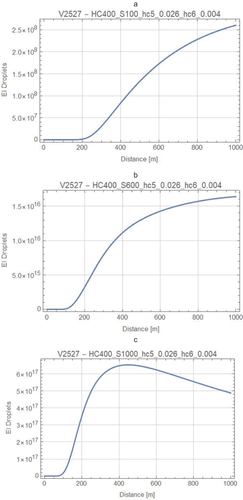
Figure 6. The partitioning of H2SO4 between the gas, droplet, and soot coating phases is shown versus downstream distance for the 400 pmmv, Nom/Nom, and FSC = 100 ppmm case for the V2527 engine.
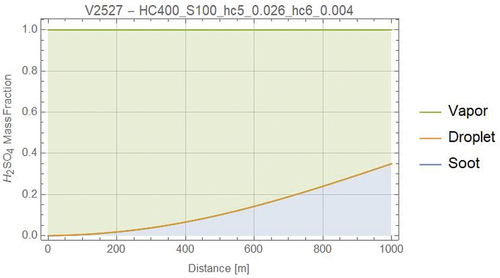
Figure 7. SO4 content of droplets as a function of FSC at 250 m
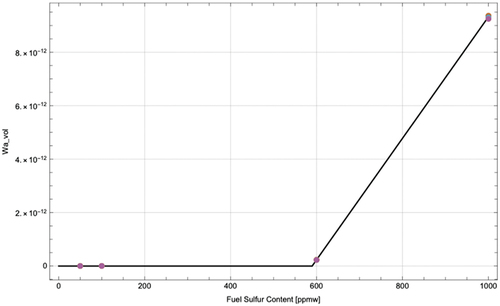
Figure 8. SO4 content of soot coatings as a function of FSC at 250 m
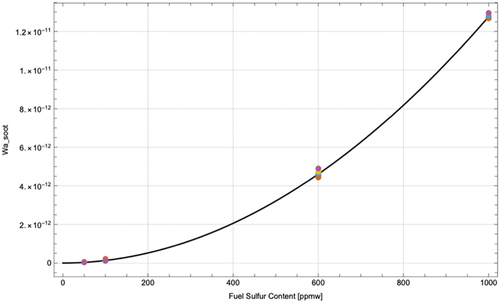
Figure 9. HC content of droplets as a function of HC and FSC at 250 m
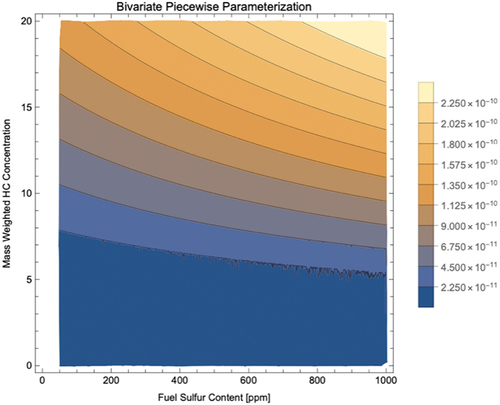
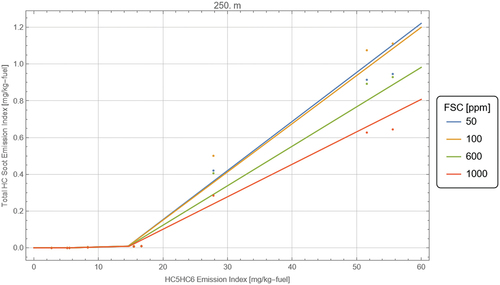
Figure 10. HC content of soot coatings as a function of HC and FSC at 250 m
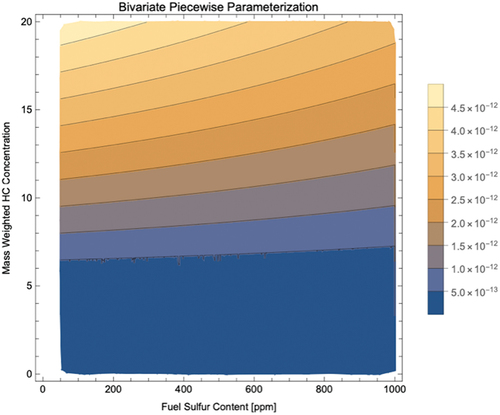
Figure 11. Number Density of droplets as a function of FSC at 250 m
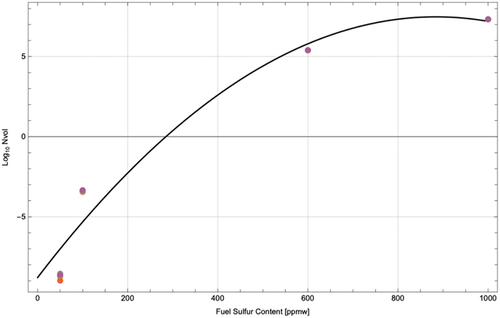
Figure 12. SO4 content of droplets as a function of FSC at 1000 m
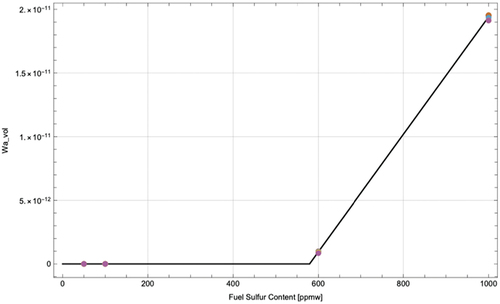
Figure 13. SO4 content of soot coatings as a function of FSC at 1000 m
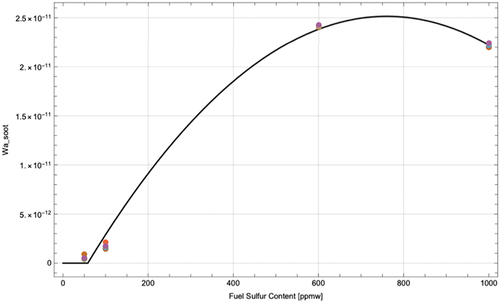
Figure 14. HC content of droplets as a function of HC and FSC at 1000 m
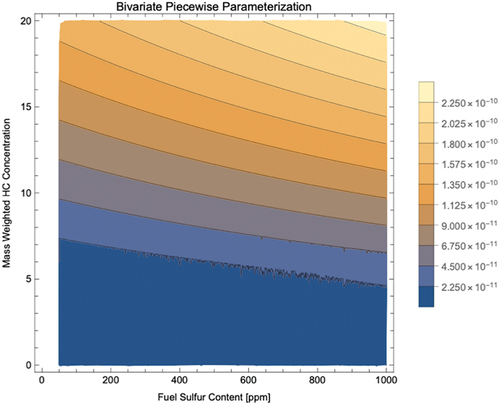
Figure 15. HC content of soot coatings as a function of HC and FSC at 1000 m
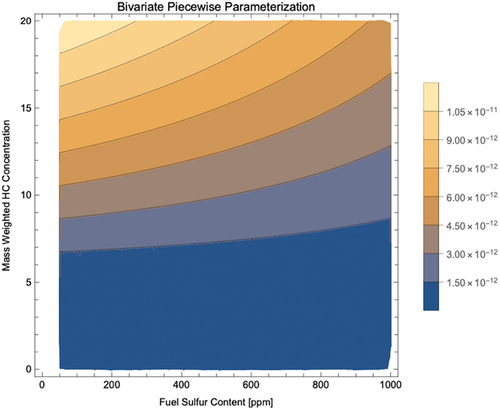
Figure 16. Number Density of droplets as a function of FSC at 1000 m
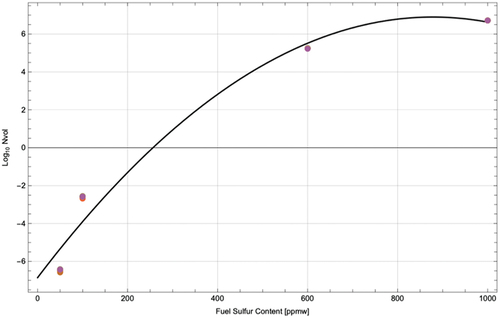
Table 2. Ratio of EI273 K/EI290 K for H2SO4 and HCs for droplets and soot coatings at both 250 m (49.2 s) and 1000 m (13.05 min) for the “diagonal” matrix cases.
Figure 17. The sulfuric acid and water content of the droplets
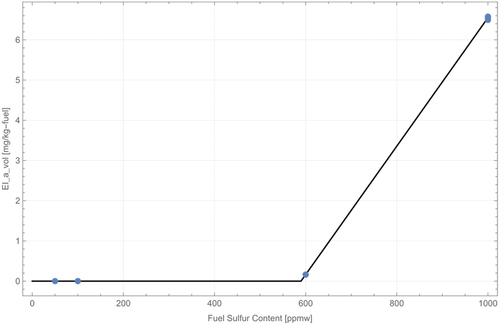
Figure 18. The organic content of the droplets
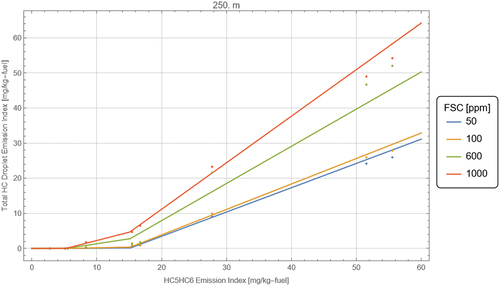
Figure 19. The number of droplets
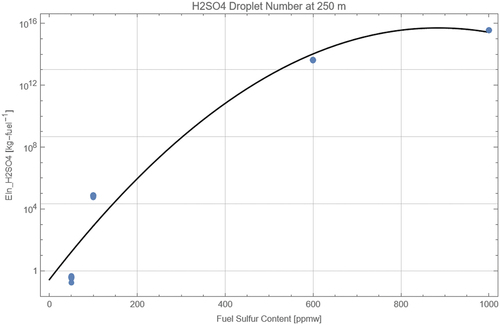
Figure 20. The sulfuric acid and water content of the soot coatings
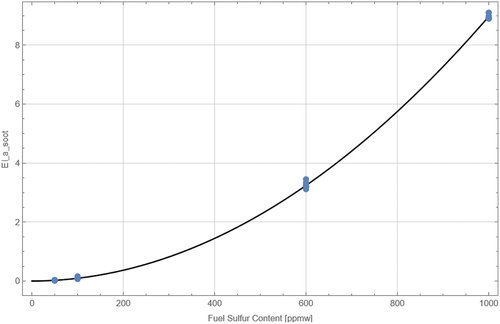
Figure 21. The organic content of the soot coatings
vPM Parameterization_SI.pdf
Download PDF (914.6 KB)Data Availability Statement
The authors confirm that the data supporting the findings of this study are available within the article and its supplementary materials.