
Figures & data
Figure 1. Photos from the field site. (a) The instrument trailer located on a grassy field at the EPA/ORD/CESER facility in Edison, NJ. (b) A view of the air sampling inlet extending from the ceiling of the trailer. (c) A view of the inlet delivering sampled ambient air to the iodide CIMS instrument inside the trailer.
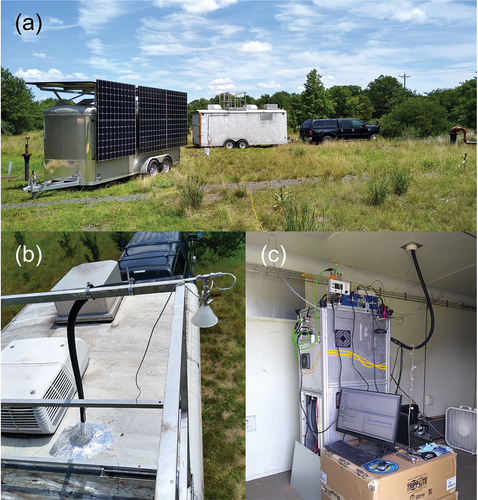
Table 1. Iodide CIMS sensitivities and LODs for PFCAs and FTOHs.
Figure 2. Time series of TFA mixing ratios (top panel) and estimated mixing ratios of C3H2F6O (middle panel) and C6HF11O3 (bottom panel). Mixing ratios are in units of parts-per-trillion by volume (pptv).
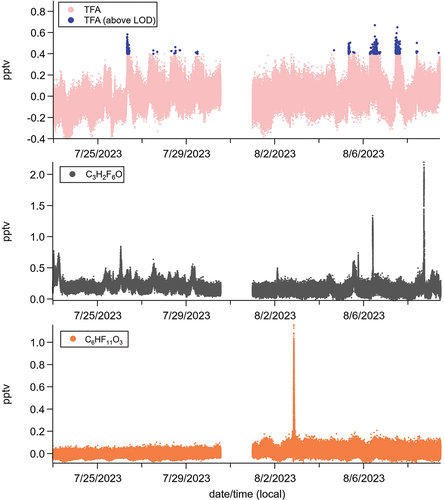
Figure 3. Diel profiles of TFA mixing ratios (top panel), estimated C3H2F6O mixing ratios (middle panel), relative CIMS signals for C5H10O3 (bottom panel; left axis), and air temperature near the field site (bottom panel; right axis). C5H10O3 likely represents a sum of isoprene hydroxyhydroperoxides (ISOPOOH) and epoxydiols (IEPOX), which are tracers for near-surface secondary photochemical production (Paulot et al. Citation2009). Shaded area represents ± one standard deviation of binned (averaged) mixing ratio data. Binned averages of TFA mixing ratios include data below instrumental LOD, and thus may not be reliable. Air temperature data are from the Rutgers PAM meteorological station (http://pamsite.rutgers.edu/).
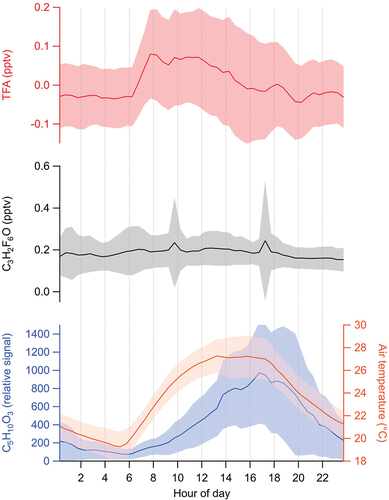
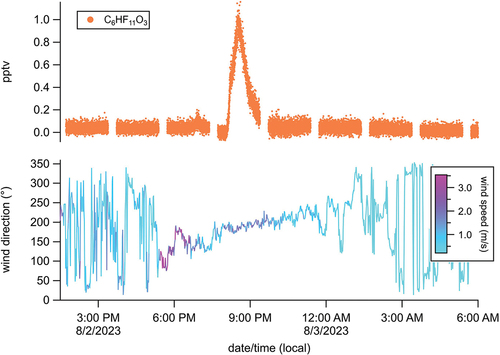
Figure 4. Estimated C6HF11O3 mixing ratios (top panel) and wind speed and direction (bottom panel) between 13:30 on 8/2/2023 and 06:00 on 8/3/2023. Wind direction data are reported in units of degrees, with 0° representing northerly winds, 90° representing easterly winds, 180° representing southerly winds, and 270° representing westerly winds. Wind speed and direction data are from the Rutgers PAM meteorological station (http://pamsite.rutgers.edu/).
Data availability statement
The data that support the findings of this study are openly available at https://doi.org/10.23719/1530551.