
Figures & data
Table 1. Mean levels of voice and efficacy by experimental condition.
Table 2A. Individual voice moderated by loyalty, OLS regression.
Table 2B. Collective voice moderated by loyalty, OLS regression.
Figure 1. Impact of response on satisfaction.
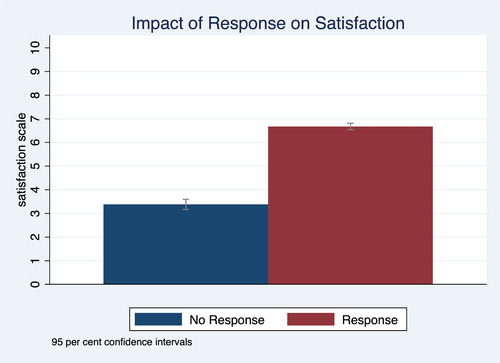
Figure 2. Impact of response on intentions to exit.
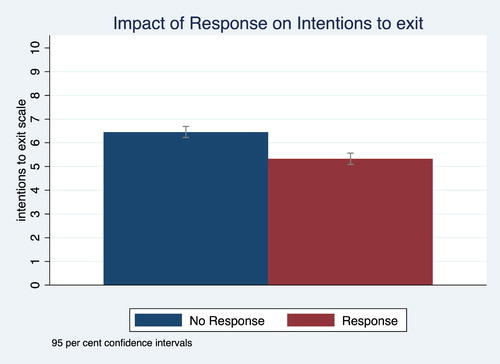
Table 3. Reactions to responses from GP moderated by loyalty and switching behaviors, OLS regressions.
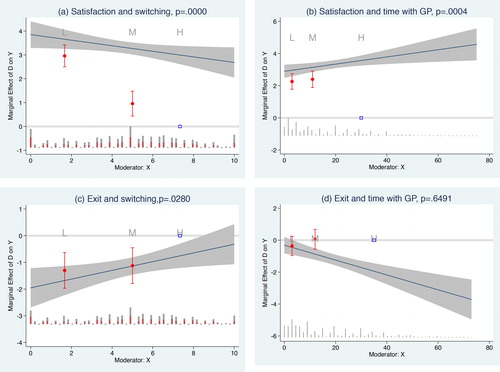
Figure 3. (a) Satisfaction and switching, p = 0.0000. (b) Satisfaction and time with GP, p = 0.0004. (c) Exit and switching, p = 0.0280. (d) Exit and time with GP, p = 0.6491.
Supplemental material