
Figures & data
Figure 1. Drop outs.
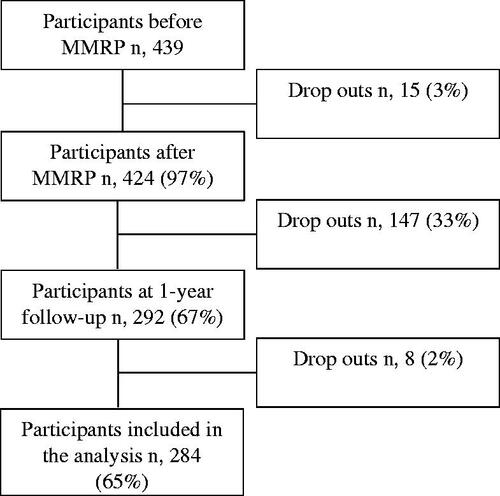
Table 1. Variables and instruments in this study.
Figure 2. The plot showed a validate plot (after 100 permutations) of the Orthogonal Partial Least Square regression model (OPLS) for the selected Y (full-time sick leave) for: (a) all participants; (b) women; (c) men; (d) age group 31–45 years and (e) age group 46–65 years. The horizontal axis showed the correlation between the permuted Y vectors and the original vector of the full-time sick leave. The original Y had the correlation 1.0 with itself and defined the high point of the horizontal axis. For validity, the values of R2 and Q2 for the original model on the right are higher than the permuted model to the left or the Q2 regression line intersects the vertical axis at or below zero.
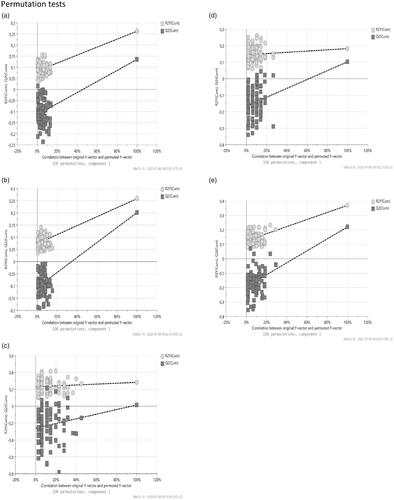
Table 2. Participants’ characteristics.
Table 3. Sick leave before and one year after MMRP .
Figure 3. Combined OPLS loading column plot for the predictive component in the model for full-time sick leave 1 year after MMRP with 95% jack-knife confident interval bars. Relationship between the X variables (loadings before MMRP, light grey) and the loading for the Y variable (full-time sick leave 1 year after MMRP, dark grey). Only significant variables are shown in the model. In the figure, column height indicates the importance of each variable. Values closer to zero being less important irrespective of sign (±). Same sign for Y variable and X variable means they are positively correlated. High loadings of the Y variable indicate high correlation with the predictive component and X. Model variance R2Y =26% and prediction value Q = 20%.
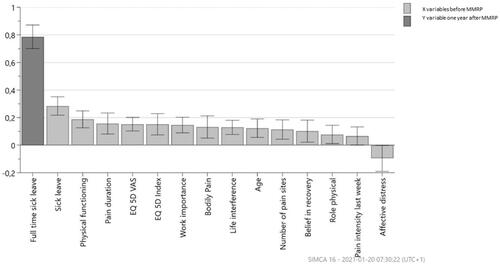
Figure 4. Combined OPLS loading column plot for the predictive component in the model for full-time sick leave 1 year after MMRP with 95% jack knife confident interval bars for women. Relationship between the X variables (loadings before MMRP, light grey) and the loading for the Y variable (full-time sick leave 1 year after MMRP, dark grey). Only significant variables are shown in the model. In the figure, column height indicates the importance of each variable. Values closer to zero being less important irrespective of sign (±). Same sign for Y variable and X variable means they are positively correlated. High loadings of the Y variable indicate high correlation with the predictive component and X. Model variance R2Y = 26.3% and prediction value Q = 13.5%.
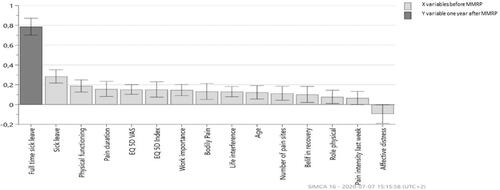
Figure 5. Combined OPLS loading column plot for the predictive component in the model for full-time sick leave 1 year after MMRP with 95% jack knife confident interval bars for men. Relationship between the X variables (loadings before MMRP, light grey) and the loading for the Y variable (full-time sick leave 1 year after MMRP, dark grey). Only significant variables are shown in the model. In the figure, column height indicates the importance of each variable. Values closer to zero being less important irrespective of sign (±). Same sign for Y variable and X variable means they are positively correlated. High loadings of the Y variable indicate high correlation with the predictive component and X. Model variance R2Y = 28% and prediction value Q = 2%.
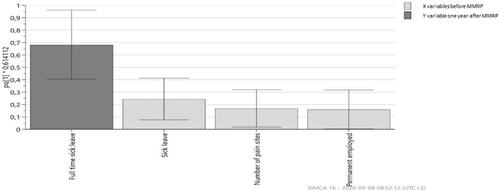
Figure 6. Combined OPLS loading column plot for the predictive component in the model for full-time sick leave 1 year after MMRP with 95% jack-knife confident interval bars for age group 31–45 years. Relationship between the X variables (loadings before MMRP, (light grey) and the loading for the Y variable (full-time sick leave 1 year after MMRP, dark grey). Only significant variables are shown in the model. In the figure, column height indicates the importance of each variable. Values closer to zero being less important irrespective of sign (±). Same sign for Y variable and X variable means they are positively correlated. High loadings of the Y variable indicate high correlation with the predictive component and X. Model variance R2Y = 18.3% and prediction value Q = 10%.
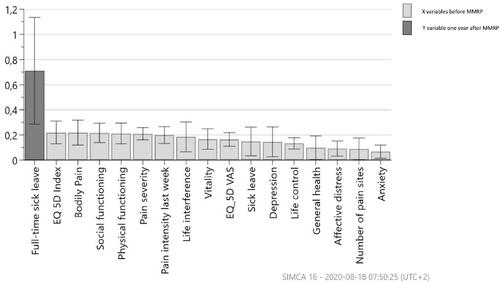
Figure 7. Combined OPLS loading column plot for the predictive component in the model for full-time sick leave 1 year after MMRP with 95% jack-knife confident interval bars for the age group 46–65 years. Relationship between the X variables [loadings before MMRP, (light grey) and the loading for the Y variable (full-time sick leave 1 year after MMRP, dark grey)]. Only significant variables are shown in the model. In the figure, column height indicates the importance of each variable. Values closer to zero being less important irrespective of sign (±). Same sign for Y variable and X variable means they are positively correlated. High loadings of the Y variable indicate high correlation with the predictive component and X. Model variance R2Y = 37% and prediction value Q = 22%.
![Figure 7. Combined OPLS loading column plot for the predictive component in the model for full-time sick leave 1 year after MMRP with 95% jack-knife confident interval bars for the age group 46–65 years. Relationship between the X variables [loadings before MMRP, (light grey) and the loading for the Y variable (full-time sick leave 1 year after MMRP, dark grey)]. Only significant variables are shown in the model. In the figure, column height indicates the importance of each variable. Values closer to zero being less important irrespective of sign (±). Same sign for Y variable and X variable means they are positively correlated. High loadings of the Y variable indicate high correlation with the predictive component and X. Model variance R2Y = 37% and prediction value Q = 22%.](/cms/asset/214ba4ce-38ac-4ea9-b21d-8470e20ed513/iocc_a_1903990_f0007_b.jpg)