
Figures & data
Table 1. Demographic Characteristics, fluid intake, type of surgery and ASA status fluid intake,type of surgery and ASA status fluid intake,type of surgery and ASA status of included participants in Crystalloids and Colloids groups.
Figure 1. Flow diagram of Demographic Characteristics
Table 2. Comparison of different parameters between Crystalloids and Colloids groups
Figure 2. Mean serum Lactate (mmol/L) along time between two treatment groups
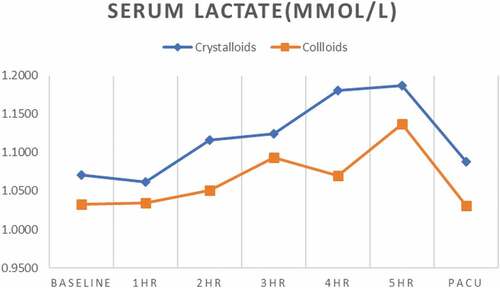
Figure 3. Mean Central Venous Oxygen Saturation (%) along time between two treatment groups
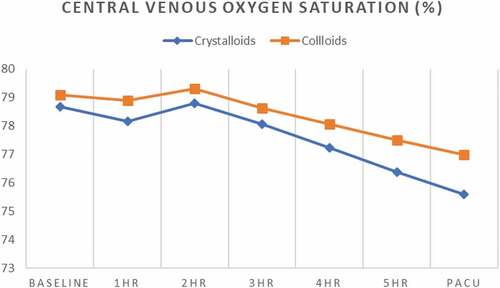
Figure 4. Mean Carbon Dioxide gap (mmHg) along time between two treatment groups
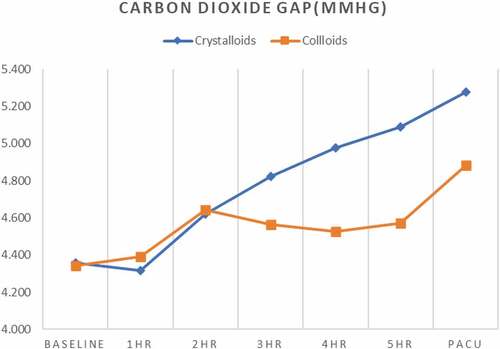
Table 3. Correlation of different parameters with Carbon Dioxide gap (ml) at 5 hours intraoperative
Table 4. Linear regression model for prediction of Carbon Dioxide gap