
Figures & data
Figure 1. Study flow chart.
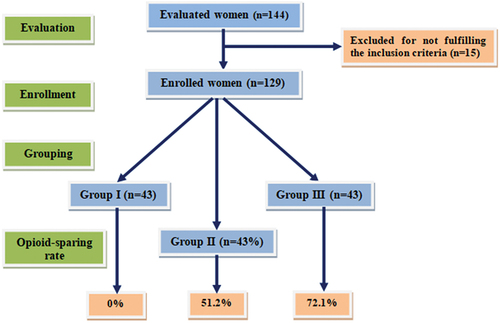
Table 1. Demographic and clinical data of the enrolled patients of the studied groups.
Table 2. Operative data of the enrolled patients of the studied groups.
Figure 2. Patients’ distribution according to the received doses of PO opioids.
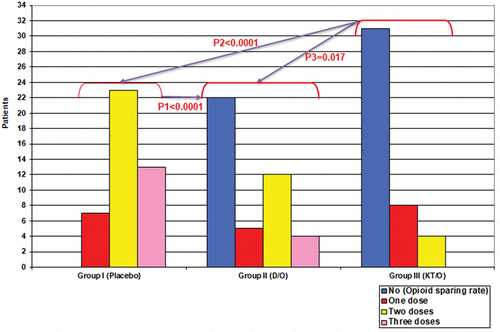
Table 3. PO pain data of patients of the studied groups.
Table 4. PO side effects and satisfaction scores by the use of PO infusions.