591
Views
8
CrossRef citations to date
0
Altmetric
Articles

Do habitat features affect the composition of silk proteins by Namibian arid-adapted Ariadna spiders (Araneae: Segestriidae)?

, , , , &
Pages 48-60 | Received 06 May 2014, Accepted 01 Oct 2014, Published online: 31 Oct 2014

Figures & data

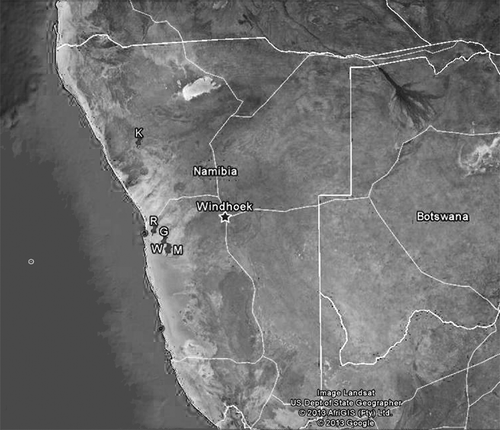
Figure 1. Map of the fieldwork stations.

Figure 1. Map of the fieldwork stations.

Table I. Granulometric soil analysis of the research stations. Values are expressed as percentages.

Table II. Arithmetic means and standard deviation of recorded parameters in different fieldwork stations.

Figure 2. Discriminant analysis. Plot of the first two canonical variables and centroids of the five populations.
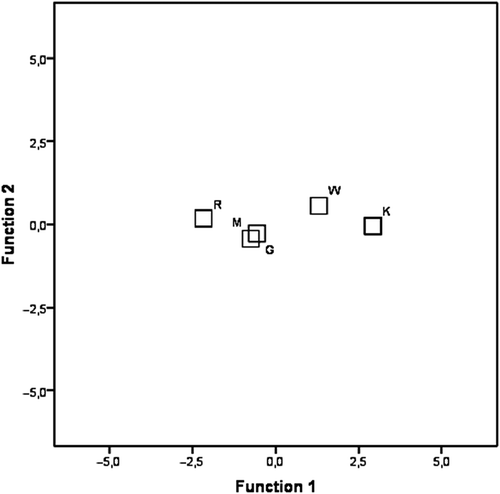
Figure 2. Discriminant analysis. Plot of the first two canonical variables and centroids of the five populations.

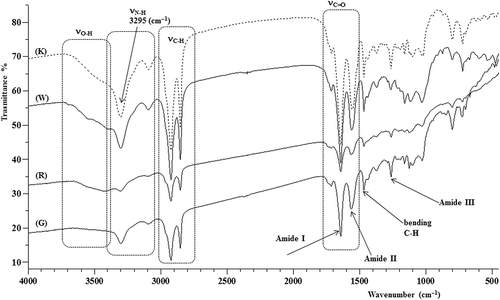
Figure 3. Fourier transform infrared (FT-IR) spectra of K, W, R and G silk.

Figure 3. Fourier transform infrared (FT-IR) spectra of K, W, R and G silk.

Figure 4. Matrix-assisted laser desorption/ionization time-of-flight (MALDI-TOF) mass spectrum of the M silk. Peaks spaced at 198 Da, 199 Da and 215 Da are labeled with the symbol *, whereas those spaced at 231 Da and 245 Da are marked with the symbol •.
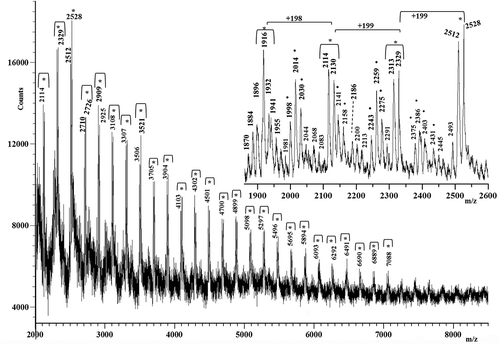
Figure 4. Matrix-assisted laser desorption/ionization time-of-flight (MALDI-TOF) mass spectrum of the M silk. Peaks spaced at 198 Da, 199 Da and 215 Da are labeled with the symbol *, whereas those spaced at 231 Da and 245 Da are marked with the symbol •.

Figure 5. Matrix-assisted laser desorption/ionization time-of-flight (MALDI-TOF) mass spectrum of the K silk.
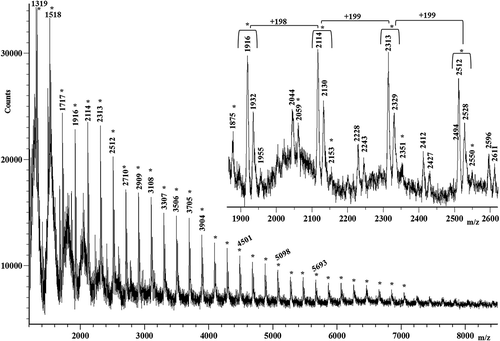
Figure 5. Matrix-assisted laser desorption/ionization time-of-flight (MALDI-TOF) mass spectrum of the K silk.

Figure 6. Matrix-assisted laser desorption/ionization time-of-flight (MALDI-TOF) mass spectrum of the R silk.
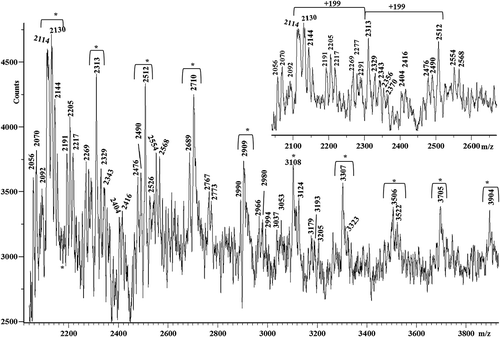
Figure 6. Matrix-assisted laser desorption/ionization time-of-flight (MALDI-TOF) mass spectrum of the R silk.

Figure 7. Matrix-assisted laser desorption/ionization time-of-flight (MALDI-TOF) mass spectra in the higher mass range of M, K, R, W and G silks.
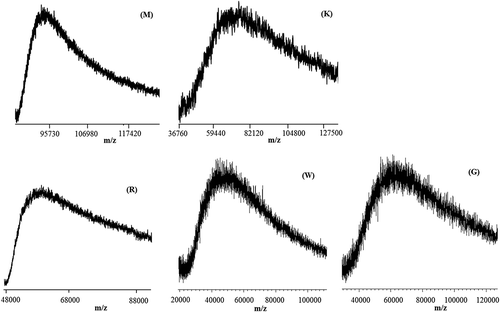
Figure 7. Matrix-assisted laser desorption/ionization time-of-flight (MALDI-TOF) mass spectra in the higher mass range of M, K, R, W and G silks.

Figure 8. Differential scanning calorimetry (DSC) curves in the range from –70 to 180°C (recorded at 10 C/min) in the first heating run of the different silks.
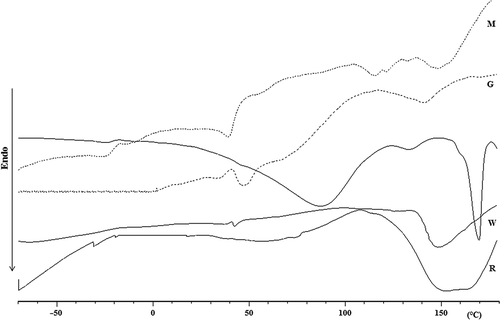
Figure 8. Differential scanning calorimetry (DSC) curves in the range from –70 to 180°C (recorded at 10 C/min) in the first heating run of the different silks.

Table III. Mass differences of the most common amino acid sequences.

Table IV. Assignments of the most important peaks observed in the low mass range of the matrix-assisted laser desorption/ionization time-of-flight (MALDI-TOF) mass spectra of the silks M, R and K. In parentheses are reported the variable amino acids sequences of each polypeptide.

Reprints and Corporate Permissions

Please note: Selecting permissions does not provide access to the full text of the article, please see our help page How do I view content?

To request a reprint or corporate permissions for this article, please click on the relevant link below:

Academic Permissions

Please note: Selecting permissions does not provide access to the full text of the article, please see our help page How do I view content?

Obtain permissions instantly via Rightslink by clicking on the button below:

If you are unable to obtain permissions via Rightslink, please complete and submit this Permissions form. For more information, please visit our Permissions help page.