Figures & data
Table 1. Karyological data in the Santolina chamaecyparissus complex.
Figure 1. Monoploid idiograms (x = 9) of the studied species of the Santolina chamaecyparissus complex, based on the mean values reported in Table S2. For Santolina chamaecyparissus a holoploid idiogram is presented, based on the mean values reported in Table S3. The last 15 chromosomes of S. chamaecyparissus cannot be grouped by five on morphological grounds. Consequently, according to their mean arm ratio, they have been grouped in one group of seven submetacentric chromosomes, and one group of eight subtelocentric chromosomes. Metacentric and submetacentric chromosomes are coloured in blue, while subtelocentric chromosomes are coloured in red.
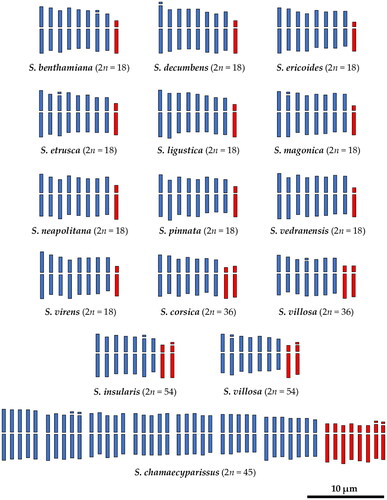
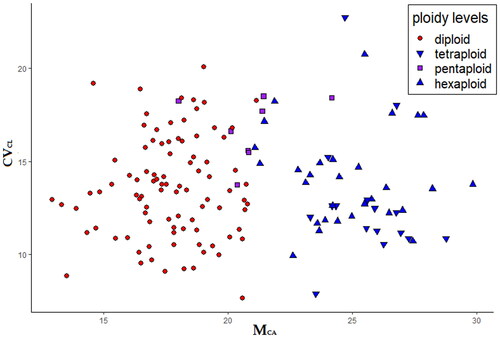
Figure 3. Karyotype asymmetry in the Santolina chamaecyparissus complex. The scatter plot shows the karyotype asymmetry of each measured metaphase plate (see also Table S1), expressed by Mean Centromeric Asymmetry (on x-axis) and Coefficient of Variation of Chromosome Length (on y-axis) values.